

Abbiamo poi proceduto a montare il drive su piattaforma Intel Z690 con processore i9-13900K, e abbiamo ripetuto tutta la nostra suite di test:
Crystal Disk Mark 8.0.4
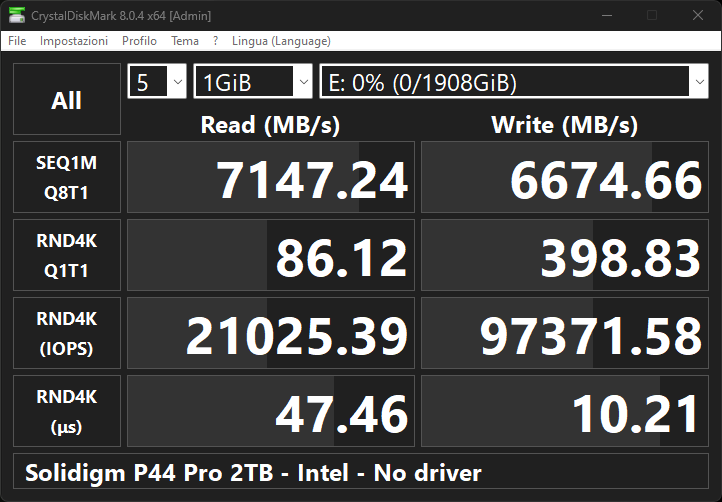
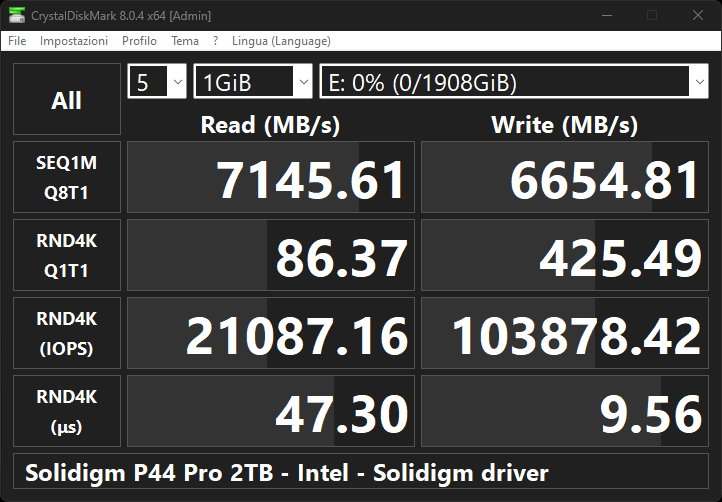
Bar chart. Sort: Read 4K Q1T1 - Higher is better. Data table with 5 rows and 5 columns follows.
| Read Seq1M Q8T1 | Write Seq1M Q8T1 | Read 4K Q1T1 | Write 4K Q1T1 | |
|---|---|---|---|---|
| Samsung 990 Pro 2 TB | 7.133,9 | 6.805,4 | 103,8 | 396,4 |
| Solidigm P44 Pro 2 TB + driver | 7.145,6 | 6.654,8 | 86,4 | 425,5 |
| Solidigm P44 Pro 2 TB | 7.147,2 | 6.674,7 | 86,1 | 398,8 |
| Sabrent Rocket 4 Plus 2 TB B47R | 7.044,1 | 6.798,3 | 85,4 | 419,9 |
ATTO Disk Benchmark
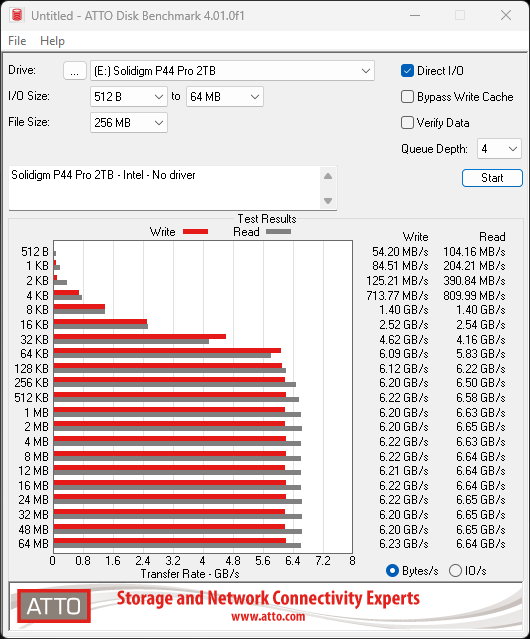
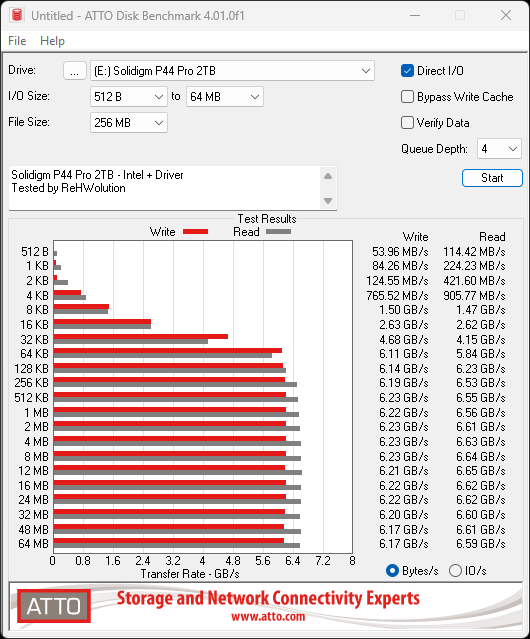
Bar chart. Sort: Write 1MB - Higher is better. Data table with 5 rows and 5 columns follows.
| Write 4KB | Read 4KB | Write 1MB | Read 1MB | |
|---|---|---|---|---|
| Samsung 990 Pro 2 TB | 943,9 | 928,2 | 6.481,9 | 6.799,4 |
| Sabrent Rocket 4 Plus 2 TB B47R | 669,3 | 766,5 | 6.451,2 | 6.717,4 |
| Solidigm P44 Pro 2 TB + driver | 765,5 | 905,8 | 6.369,3 | 6.717,4 |
| Solidigm P44 Pro 2 TB | 713,8 | 810 | 6.348,8 | 6.789,1 |
AS SSD Benchmark
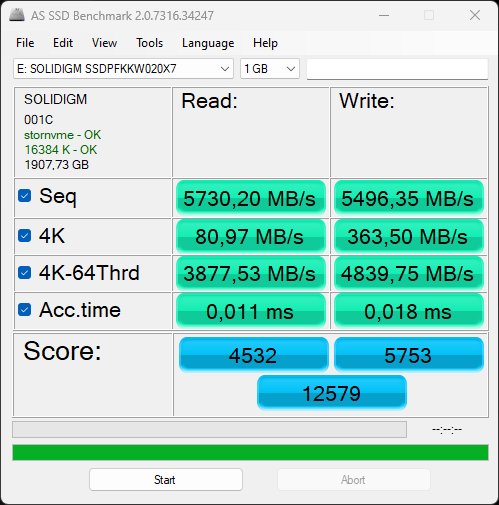
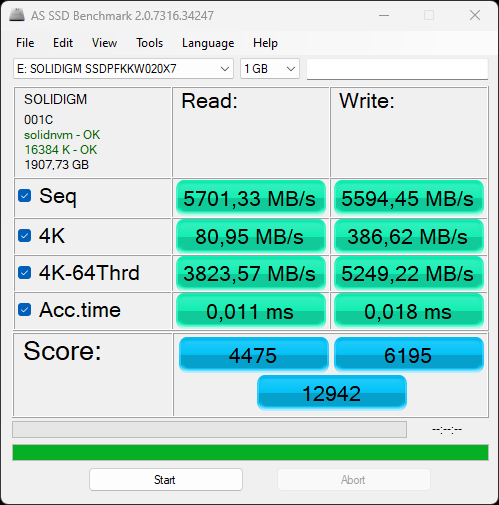
Bar chart. Sort: Total - Higher is better. Data table with 5 rows and 4 columns follows.
| Read | Write | Total | |
|---|---|---|---|
| Sabrent Rocket 4 Plus 2 TB B47R | 4.415 | 6.374 | 13.065 |
| Solidigm P44 Pro 2 TB + driver | 4.475 | 6.195 | 12.942 |
| Samsung 990 Pro 2 TB | 4.583 | 5.753 | 12.678 |
| Solidigm P44 Pro 2 TB | 4.532 | 5.753 | 12.579 |
Anvil’s Storage Utilities 1.1.0
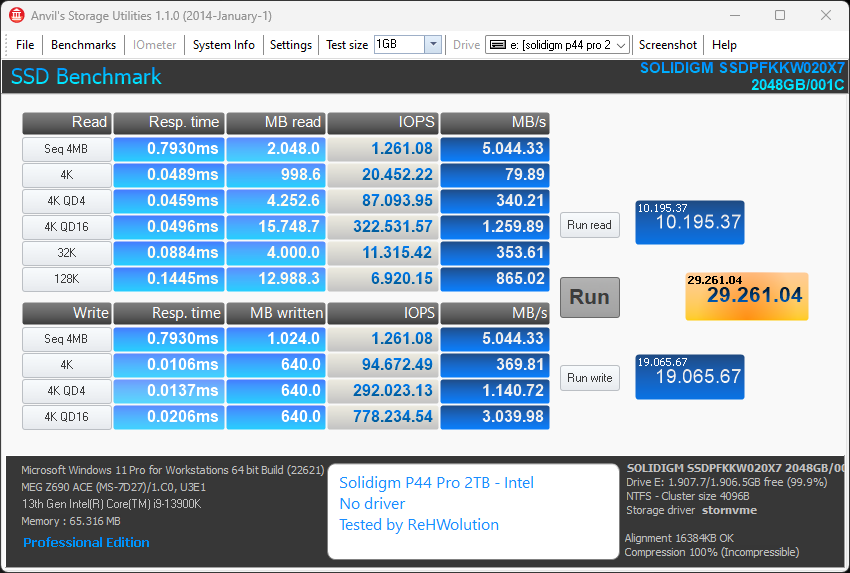
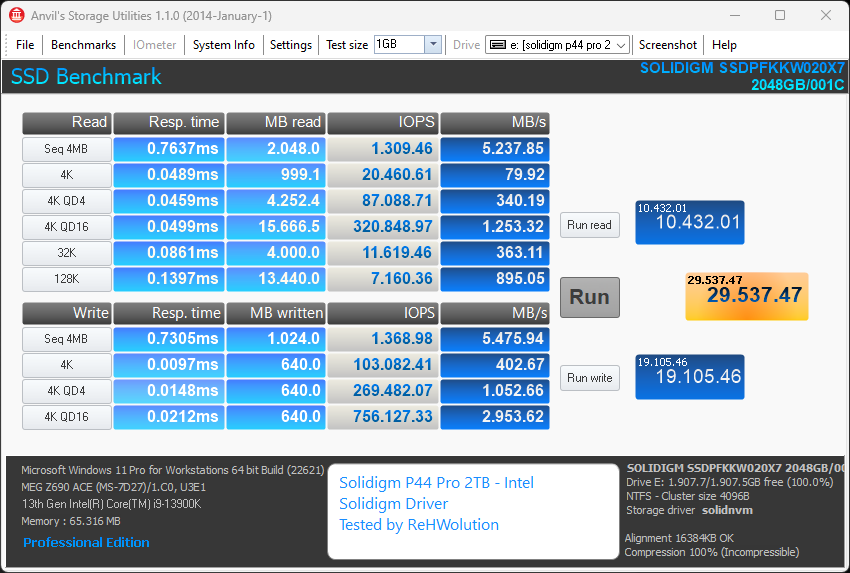
Bar chart. Sort: Total - Higher is better. Data table with 5 rows and 4 columns follows.
| Read | Write | Total | |
|---|---|---|---|
| Solidigm P44 Pro 2 TB + driver | 10.432,01 | 19.105,46 | 29.537,47 |
| Solidigm P44 Pro 2 TB | 10.195,37 | 19.065,67 | 29.261,04 |
| Sabrent Rocket 4 Plus 2 TB B47R | 9.198,54 | 18.742,23 | 27.940,77 |
| Samsung 990 Pro 2 TB | 9.986,75 | 17.439,6 | 27.426,35 |
Blackmagic Disk Speed Test Benchmark
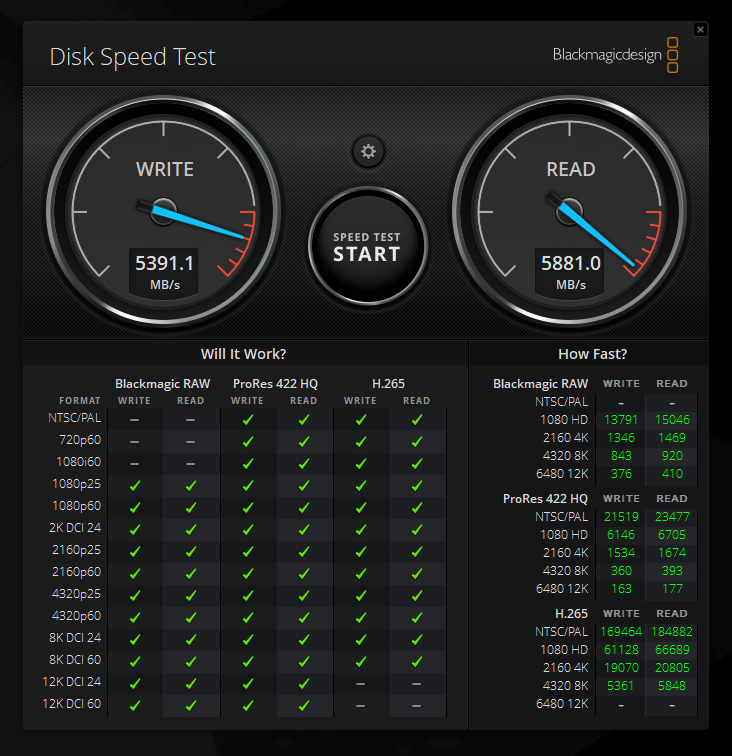
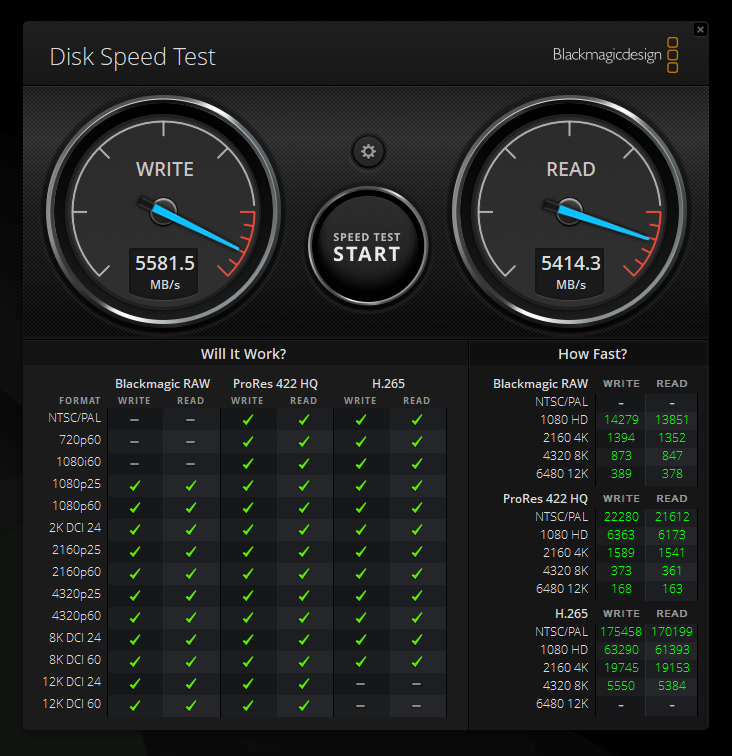
Bar chart. Sort: Read - Higher is better. Data table with 5 rows and 3 columns follows.
| Write | Read | |
|---|---|---|
| Solidigm P44 Pro 2 TB | 5.391,1 | 5.881 |
| Solidigm P44 Pro 2 TB + driver | 5.581,5 | 5.414,3 |
| Sabrent Rocket 4 Plus 2 TB B47R | 5.321,4 | 5.056,6 |
| Samsung 990 Pro 2 TB | 5.194,5 | 4.988,9 |
DiskBench 2.8.1.0 – 100 GB Copy Test
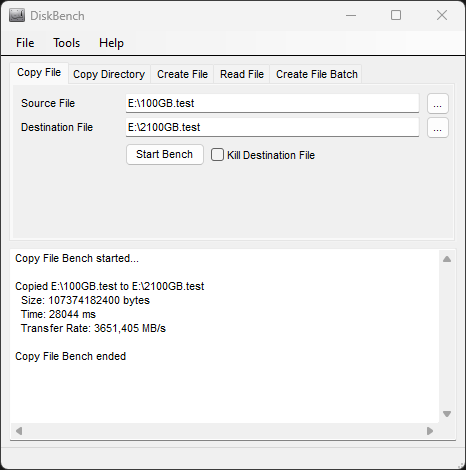
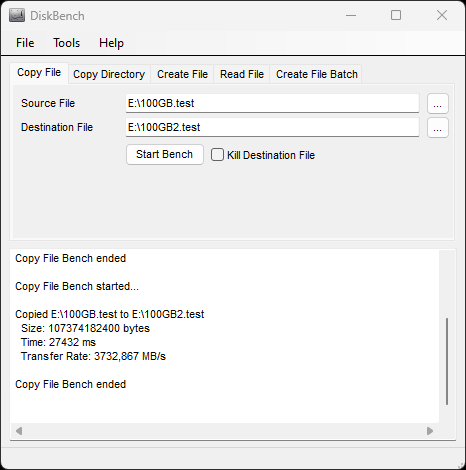
Bar chart. Copy test - 100 GB. Data table with 4 rows and 2 columns follows.
| Copy 100 GB | |
|---|---|
| Solidigm P44 Pro 2 TB + driver | 3.732,9 |
| Solidigm P44 Pro 2 TB | 3.651,4 |
| Sabrent Rocket 4 Plus 2 TB B47R | 3.646,6 |
UL Benchmarks 3DMark Storage Benchmark
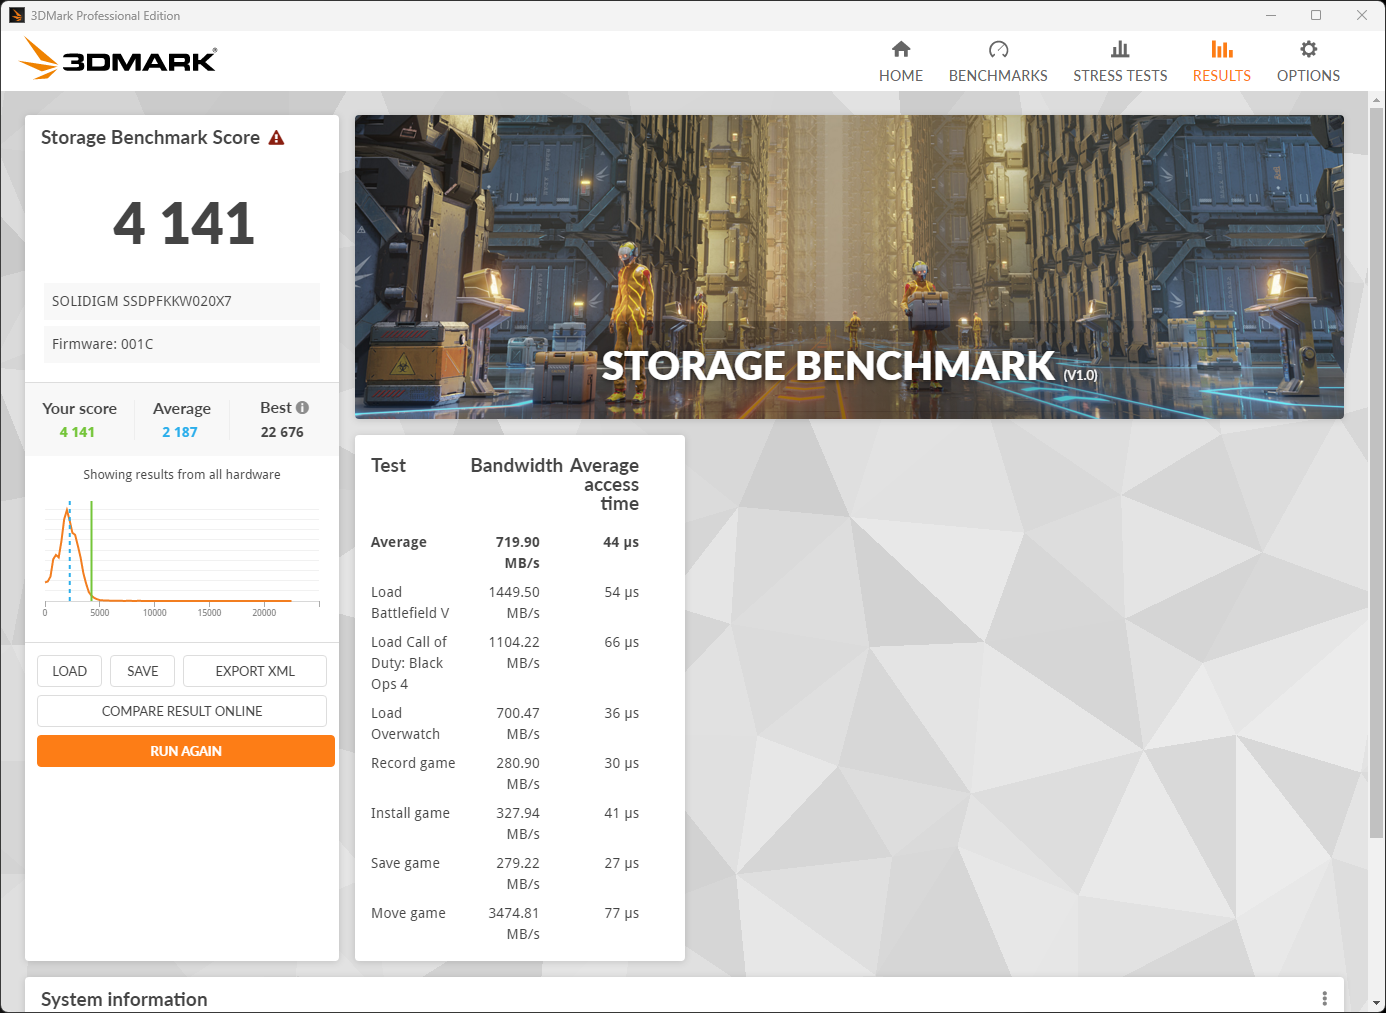
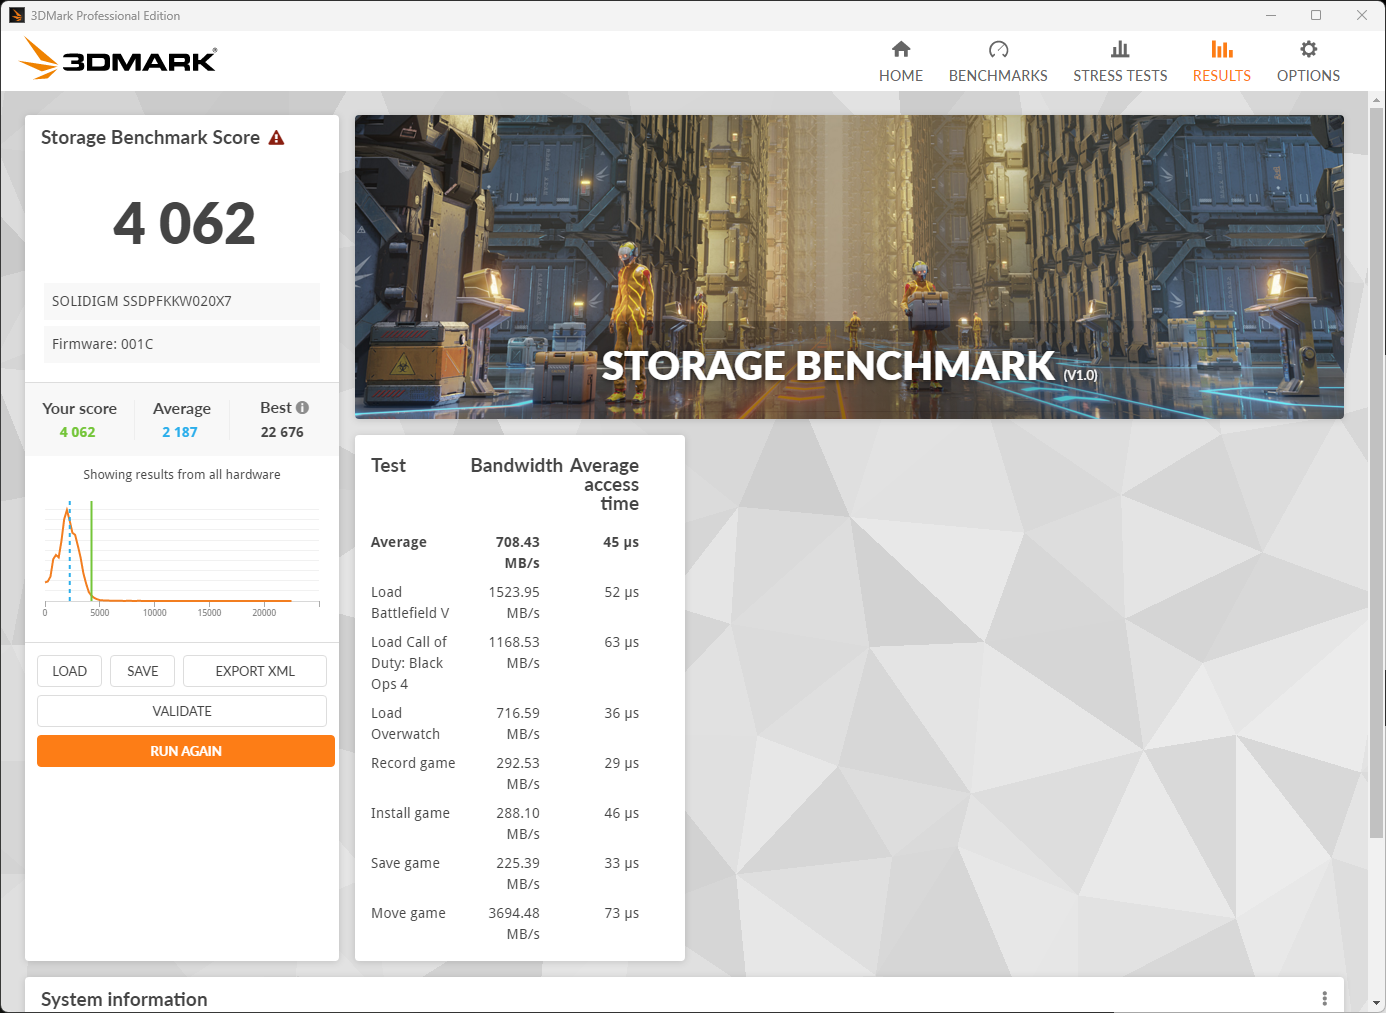
Bar chart. Points. Data table with 4 rows and 2 columns follows.
| Score | |
|---|---|
| Solidigm P44 Pro 2 TB | 4.141 |
| Solidigm P44 Pro 2 TB + driver | 4.062 |
| Sabrent Rocket 4 Plus 2 TB B47R | 3.783 |
UL Benchmarks PCMark 10 Storage
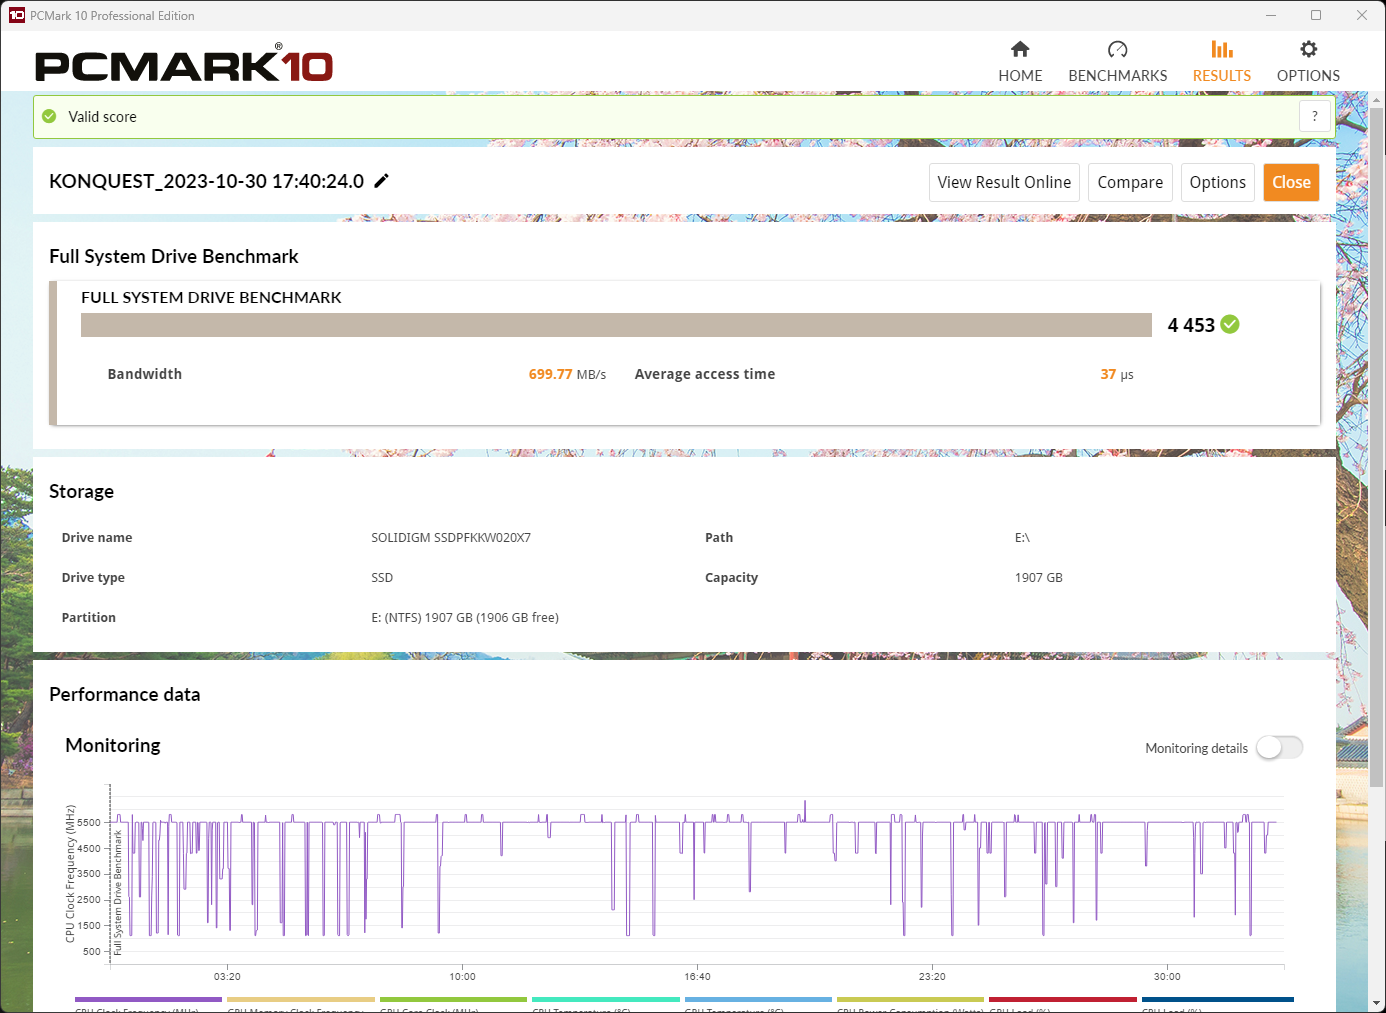
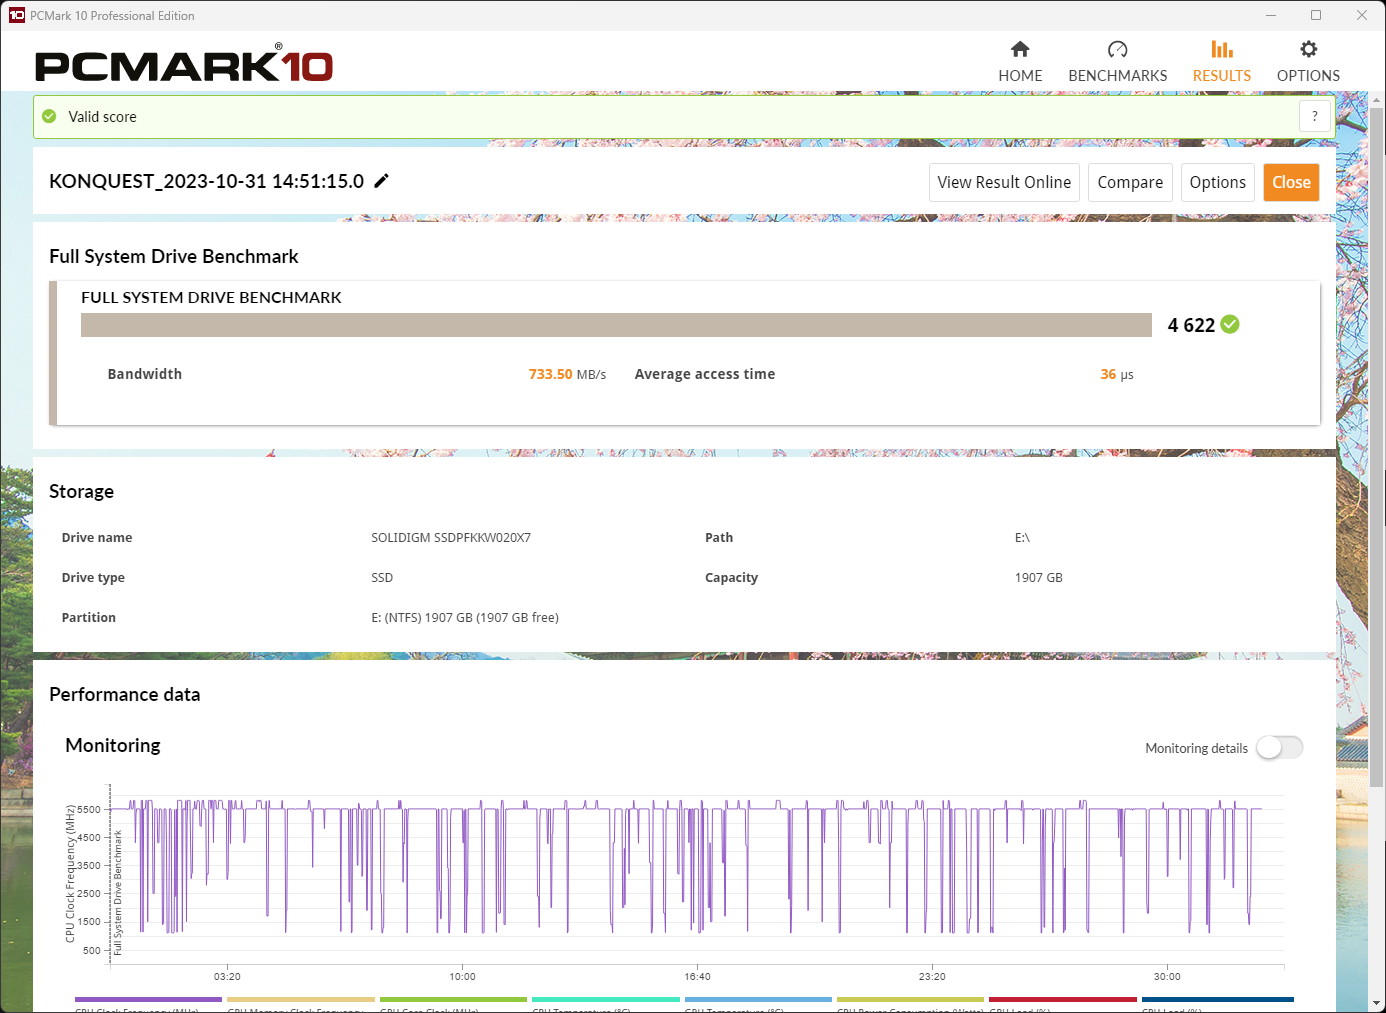
Bar chart. Full System Drive Benchmark. Data table with 4 rows and 2 columns follows.
| Full | |
|---|---|
| Solidigm P44 Pro 2 TB + driver | 4.622 |
| Solidigm P44 Pro 2 TB | 4.453 |
| Sabrent Rocket 4 Plus 2 TB B47R | 3.577 |
Su piattaforma Intel, i risultati sono fondamentalmente differenti: se AMD permette di raggiungere velocità sequenziali di gran lunga superiori, con risultati in linea con 7500 MB/s in lettura e 6900 MB/s in scrittura, e prestazioni in workload ad accesso casuale inferiori, la piattaforma Intel raggiunge invece velocità sequenziali inferiori in favore di RND4K di gran lunga superiori. L’installazione dei driver proprietari di Solidigm, su entrambe le piattaforme, sposta la bilancia prestazionale dalle velocità sequenziali a quelle RND4K, migliorando di fatto le performance reali dell’SSD sacrificando qualche MB/s di cui difficilmente sentirete la mancanza.
In termini di performance assolute, il Solidigm P44 Pro è forse l’SSD mediamente più veloce tra quelli finora testati.


Discussione su post