

Introduzione: Sapphire–>
 Sapphire Technology nasce 12 anni fa come partner AIB di ATI (ora di proprietà di AMD), adottando tale modello per introdurre sul mercato le proprie innovazioni tecnologiche. SAPPHIRE, con i suoi prodotti nel settore grafico, è riuscita ad affermarsi come il partner #1 di AMD, espandendo al contempo la propria lineup con prodotti che includono mainboard e miniPC, come ad esempio la serie Sapphire EDGE.
Generazione dopo generazione, Sapphire è stata abile nel produrre soluzioni reference e personalizzate delle GPU AMD, e grazie all’ottimo lavoro svolto e alle soluzioni tecniche adottate, oggi è una delle realtà più affermate nel mondo dell’accelerazione grafica. Molti di voi facilmente ricorderanno alcune delle più famose linee dell’azienda, come la serie ATOMIC, caratterizzata da una personalizzazione totale (nell’elettronica e nel raffreddamento) delle schede di punta di AMD, o la serie VaporX, che fa dell’efficienza termica e della silenziosità il suo cavallo di battaglia.
Proprio in merito a quest’ultima serie citata, Sapphire ha investito la sua esperienza nella “nuova” serie R9-200 di AMD, la cui gamma per l’azienda consiste in ben 6 modelli, ovvero:
- R9-280X Toxic
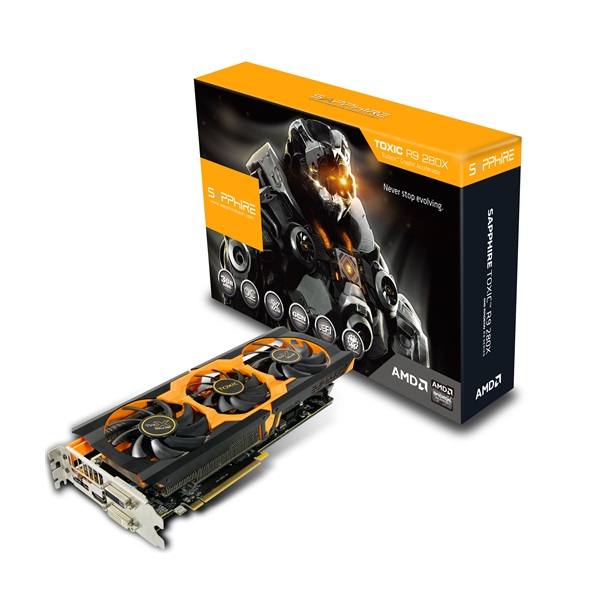
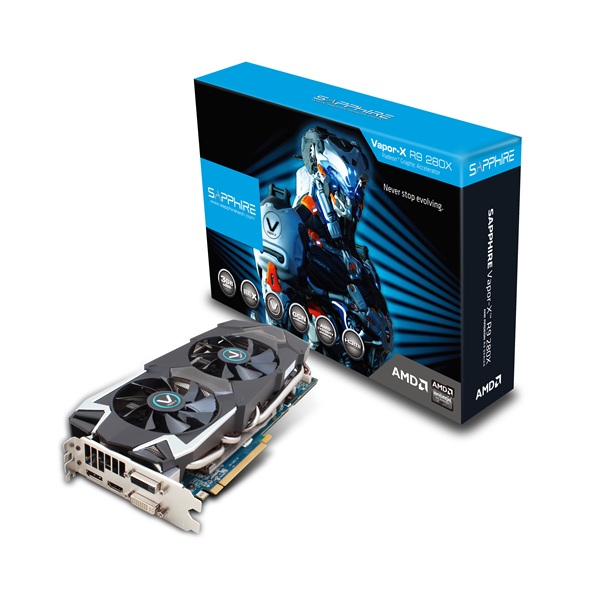
- R9-280X Vapor-X
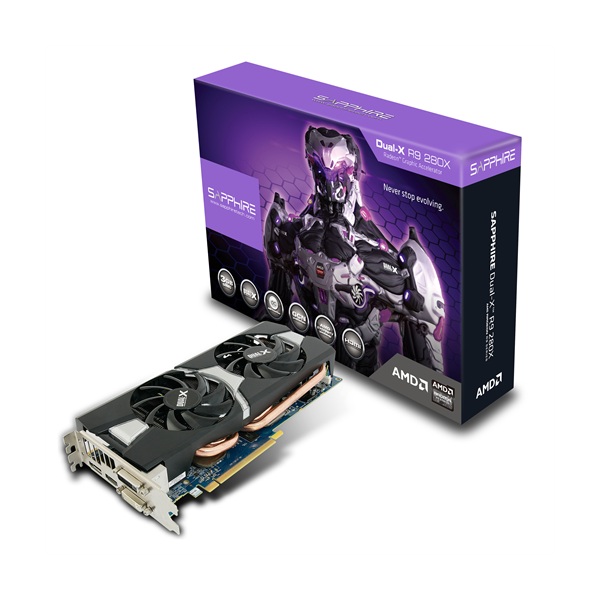
- R9-280X Dual-X
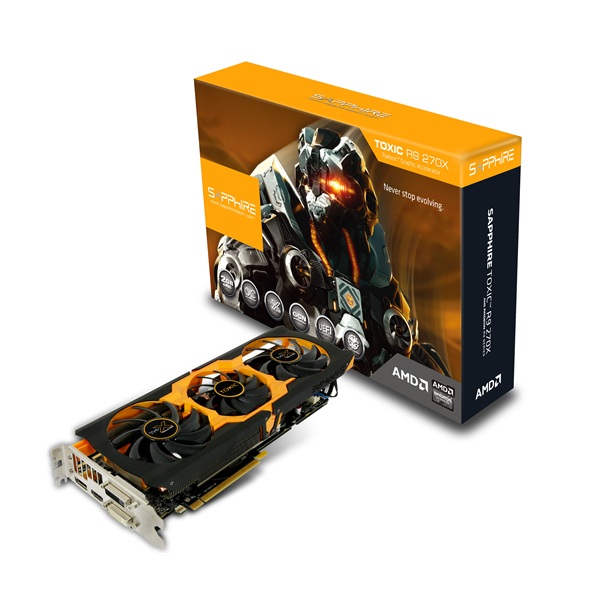
- R9-270X Toxic
- R9-270X Vapor-X

- R9-270X Dual-X
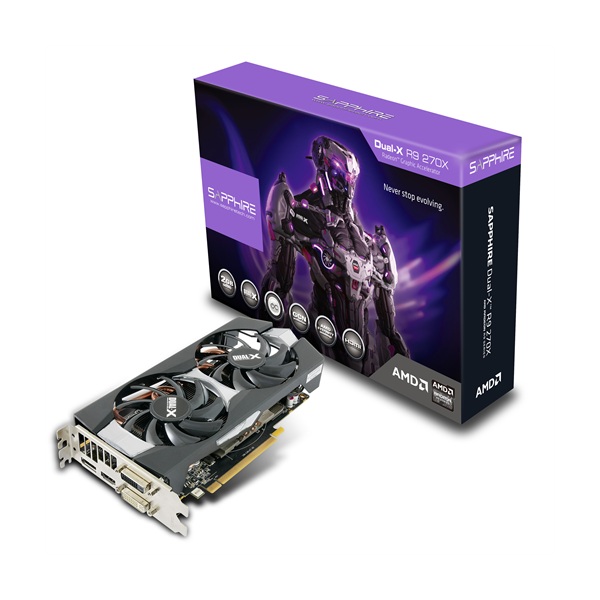
Come da titolo, analizzeremo oggi le prestazioni e le funzionalità della Sapphire Radeon R9-270X Vapor-X. Buona lettura!
Sapphire Radeon R9-270X Vapor-X: specifiche tecniche–>
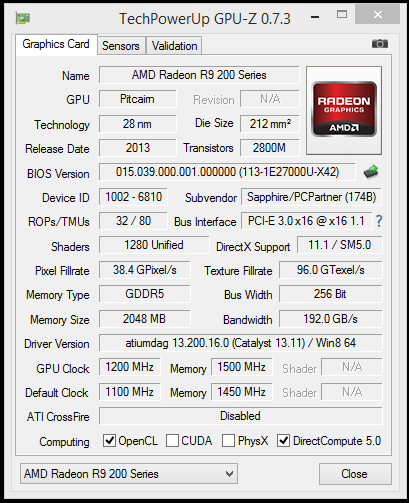
Di seguito, la tabella delle specifiche tecniche della scheda video, ulteriori informazioni sono consultabili in versione integrale sul sito ufficiale del produttore (Sapphire):
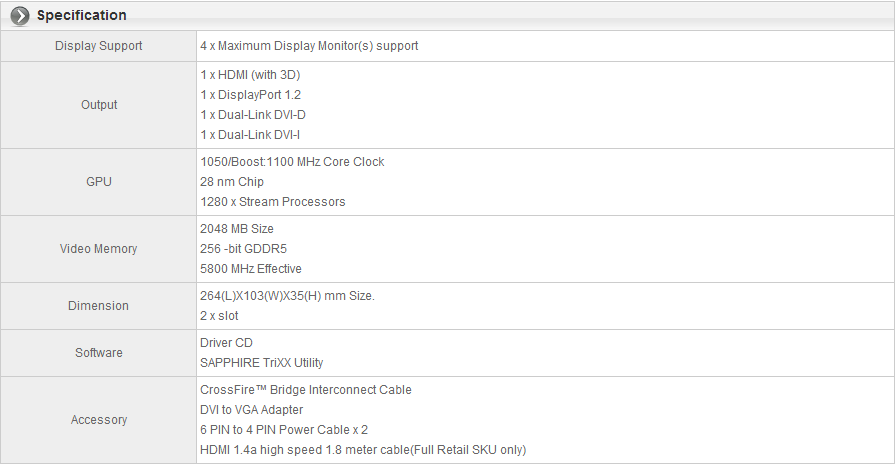
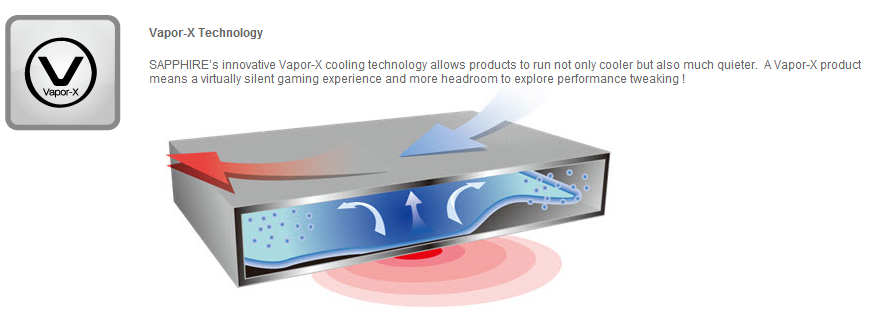
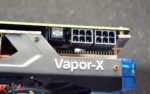
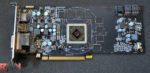
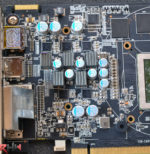
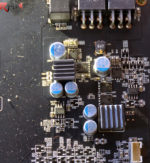
La scheda è basata su GPU Pitcairn XT, con frequenze operative pari a 1100/1450 MHz, rispettivamente sulla GPU e sulle memorie. Il design è totalmente rivisto dall’azienda, che ha modificato il PCB (rendendolo nero opaco e riorganizzando le componenti) ed il sistema di dissipazione (Vapor-X), che consiste in una camera di vapore che incrementa considerevolmente il trasferimento e lo smaltimento del calore prodotto. La dotazione di RAM è di 2GB GDDR5 attraverso un bus a 256 Bit.
La serie di connessioni sul pannello I/O è formata da: 2 x DVI (una DVI-I ed una DVI-D), 1 x HDMI compatibile con lo standard 1.4a, 1 x DisplayPort compatibile con lo standard 1.2, queste ultime due compatibili quindi con lo standard 4K e 3D.
La serie di features uniche della scheda consiste in:
Vapor-X
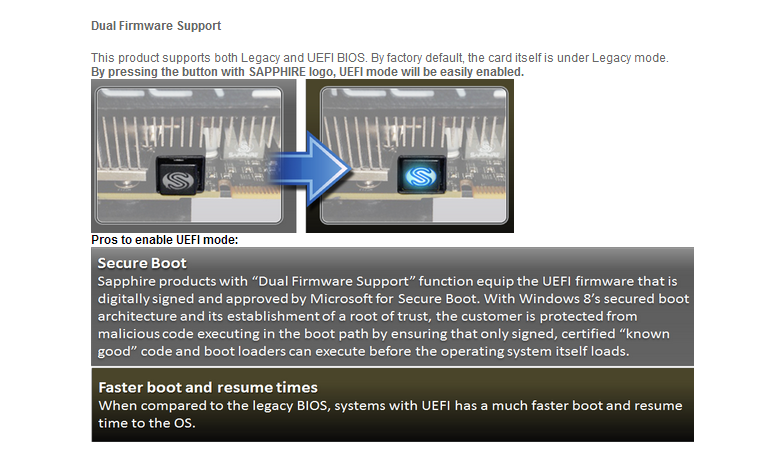
BIOS UEFI compatibile con Windows 8 Safe Boot e Fast Resume

Black Diamond Choke
Panoramica video–>
Di seguito, l’unboxing e panoramica della R9-270X Vapor-X:
Galleria fotografica: la scheda nei dettagli–>
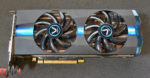
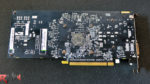
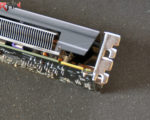
Qui, una galleria della scheda nei dettagli:


Configurazione di prova e metodologia di test–>
La configurazione utilizzata per i test è la seguente:
| Processore | Intel Core i7 4770k @ 4.8GHz |
|---|---|
| Dissipatore | Noctua NH-U14S |
| Scheda Madre | Gigabyte Z87X-OC |
| RAM | Patriot Viper 3 Sapphire Blue 16GB 2400MHz |
| Scheda Video | Sapphire Radeon R9-270X Vapor-X |
| Scheda Audio | Integrata |
| HDD/SSD | Corsair Neutron 120GTX – Samsung Spinpoint F3 1TB |
| Alimentatore | Seasonic SS1000XP |
| Case | Corsair Obsidian 750D |
| Monitor | EIZO FlexScan EcoView EV2736WFS |
| Tastiera | Corsair Vengeance K95 |
| Mouse | Razer Naga Hex + Goliathus Speed League of Legends Collector’s Edition |
| S. Operativo | Windows 8.1 Pro x64 |
Benchmark utilizzati:
- Unigine Heaven 4.0
- 3DMark06
- 3DMark11
- 3DMark
- Bioshock Infinite (Benchmark integrato)
- Resident Evil 6 Benchmark
- Metro Last Light (Benchmark integrato)
- Tomb Raider (2013) (Benchmark integrato)
Qualità massima, risoluzioni testate:
- 1680×1050, AA x2
- 1920×1080, AA x4
- 2560×1440, no AA
Schede video finora testate:
- nVidia GeForce GTX 760 (reference)
- MSI nVidia GeForce GTX 760 Hawk
- nVidia GeForce GTX 770 (reference)
- Gigabyte nVidia GeForce GTX 770 Windforce3X OC
- nVidia GeForce GTX 780 (reference)
- MSI AMD Radeon HD7790 OC
- Sapphire AMD Radeon HD7990
- Sapphire AMD Radeon HD7990 (QuadCFX)
- Sapphire AMD Radeon R9-270X Vapor-X
Test sintetici: Unigine Heaven–>Heaven, prodotto da Unigine è stato il primo Benchmark DX11. Lo scopo principale è quello di mettere in risalto gli straordinari effetti della Tessellation. Difatti dai semplici modelli osservabili con tessellation disattivata, si arriva ad oggetti ricchi di profondità e sporgenze senza dover creare trame complesse. Il compito di arricchire il modello è lasciato all’unità tessellatrice, per cui si tratta di uno strumento indispensabile per valutare l’efficienza dei questa unità nelle moderne soluzioni DX11:
Unigine Heaven Benchmark 4.0 (Z97)
Bar chart. Data table with 32 rows and 4 columns follows.
Unigine Heaven Benchmark 4.0 (Z97)
1050p
1080p
1440p
Sapphire Radeon R7 265 Dual-X
0
0
0
Sapphire Radeon R7 250 Ultimate
14,5
11,9
8,1
MSI Radeon HD7790 OC
23,5
19,5
13,1
Sapphire Radeon R7 260X OC 2GB
24,7
20,3
13,7
NVIDIA GeForce GTX750Ti
29,2
24
18,1
ASUS GeForce GTX750Ti DirectCU II OC
31
25,3
19,4
MSI Radeon R9 270 Gaming 2GB
34,4
29
20,5
ASUS Radeon R9 270X DirectCU II TOP
37,8
31,5
21,9
NVIDIA GeForce GTX760
40,5
36,1
22,3
Sapphire Radeon R9 270X Vapor-X
37,8
31,9
22,4
Sapphire Radeon R9 280 Dual-X
41,1
34,9
26,2
Gigabyte GeForce GTX760 WF3 OC 4GB
45,4
37,8
27,6
MSI GeForce GTX760 Hawk
46,6
38,4
27,6
Sapphire Radeon R9 285 ITX Compact
49
39,5
28,2
Sapphire Radeon HD7970 DualX OC
44,2
37,9
28,7
NVIDIA GeForce GTX770
53,5
43,6
31,4
Sapphire Radeon R9 280X Toxic
52,8
44,9
33,5
MSI GeForce GTX770 Gaming
57
46,7
33,8
Gigabyte GeForce GTX770 WF3 OC
59
48,2
34,8
Sapphire Radeon R9 290
65,7
55,7
40
Sapphire Radeon R9 290X
71,7
59,6
42,5
Sapphire Radeon R9 290X Tri-X OC
74,7
52,1
44,2
NVIDIA GeForce GTX780
73,4
61,7
46,7
Sapphire Radeon R9 290X Vapor-X Tri-X OC
77,8
64,9
46,9
MSI GeForce GTX780 OC Gaming
72,7
61,5
47
Inno3D GeForce GTX780 iChill Accelero Hybrid
82,7
69,3
52,2
Sapphire Radeon HD7990
86,6
74
52,9
NVIDIA GeForce GTX780Ti
83,9
70,8
53,6
Sapphire Radeon HD7970 DualX OC CFX
87,7
74,1
56,4
MSI GeForce GTX780Ti Gaming
94,2
79
60,3
Sapphire Radeon HD7990 CFX
162,3
140,4
102,5
Test sintetici: FutureMark 3DMark11–>3DMark11 è il penultimo nato di Futuremark. Finalmente, dopo una lunga attesa, è possibile testare le più recenti VGA in ambiente DX11 con la qualità del più rinomato benchmark. Il 3DMark11 consiste in quattro test grafici che fanno uso intensivo di Tessellation (particolare tecnologia introdotta con le DirectX11), un Physics Test esclusivamente dedicato alla CPU ed un Combined Test che mette sotto torchio allo stesso tempo il comparto grafico ed il processore:
3DMark11 (Z97)
Bar chart. Data table with 31 rows and 2 columns follows.
3DMark11 (Z97)
3DMarks
Sapphire Radeon R7 250 Ultimate
3.346
NVIDIA GeForce GTX750Ti
5.699
MSI Radeon HD7790 OC
6.079
Sapphire Radeon R7 260X OC 2GB
6.741
Sapphire Radeon R7 265 Dual-X
7.097
MSI Radeon R9 270 Gaming 2GB
8.079
NVIDIA GeForce GTX760
8.273
Gigabyte GeForce GTX760 WF3 OC 4GB
8.656
Sapphire Radeon R9 270X Vapor-X
8.939
ASUS Radeon R9 270X DirectCU II TOP
9.120
MSI GeForce GTX760 Hawk
9.294
Sapphire Radeon R9 280 Dual-X
9.360
Sapphire Radeon HD7970 DualX OC
9.963
NVIDIA GeForce GTX770
10.446
Sapphire Radeon R9 285 ITX Compact
10.558
MSI GeForce GTX770 Gaming
11.244
Gigabyte GeForce GTX770 WF3 OC
11.414
Sapphire Radeon R9 280X Toxic
11.603
MSI GeForce GTX780 OC Gaming
12.726
NVIDIA GeForce GTX780
12.848
Sapphire Radeon R9 290
13.311
Inno3D GeForce GTX780 iChill Accelero Hybrid
13.736
NVIDIA GeForce GTX780Ti
13.956
Sapphire Radeon R9 290X
14.006
Sapphire Radeon R9 290X Tri-X OC
14.263
Sapphire Radeon R9 290X Vapor-X Tri-X OC
14.534
MSI GeForce GTX780Ti Gaming
14.832
Sapphire Radeon HD7990
15.047
Sapphire Radeon HD7970 DualX OC CFX
16.360
Sapphire Radeon HD7990 CFX
22.352
Test sintetici: FutureMark 3DMark–> In concomitanza con il lancio di Windows 8, Futuremark ha lanciato il nuovo 3DMark, chiamato appunto 3DMark, senza alcun numero riconoscitivo, a segnare la forte integrazione che ha con qualsiasi sistema, da Android a Windows a iOS a OSX, dando per la prima volta la possibilità di paragonare le prestazioni su smartphone e PC fisso in maniera schematizzata e professionale. I test di cui si compone sono tre:
- Ice Storm, basato su DirectX9, indicato per computer non recentissimi e sistemi mobile. Con l’ultima patch, è possibile eseguire la versione Extreme, con cui stressare in risoluzione FullHD i tablet ad alta risoluzione/potenza di calcolo.
- Cloud Gate, basato su DirectX10, indicato per computer portatili di recente generazione e GPU anche datate.
- Fire Strike, basato su DirectX11.1, indicato per sistemi desktop ad alte prestazioni. Il benchmark è eseguibile anche in modalità Extreme, che consente di sfruttare a pieno e sforzare i sistemi multi-GPU di fascia alta.
3DMark (Z97)
Bar chart. Data table with 31 rows and 4 columns follows.
3DMark (Z97)
Ice Storm
Cloud Gate
Fire Strike
Sapphire Radeon R7 250 Ultimate
116.514
13.908
2.132
MSI Radeon HD7790 OC
130.573
18.215
3.722
Sapphire Radeon R7 260X OC 2GB
162.417
18.985
3.917
NVIDIA GeForce GTX750Ti
136.161
20.004
3.929
Sapphire Radeon R7 265 Dual-X
176.701
21.892
4.735
MSI Radeon R9 270 Gaming 2GB
180.130
22.463
5.287
NVIDIA GeForce GTX760
159.421
23.409
5.678
Gigabyte GeForce GTX760 WF3 OC 4GB
166.434
23.897
5.773
Sapphire Radeon R9 270X Vapor-X
167.274
23.625
5.825
ASUS Radeon R9 270X DirectCU II TOP
182.333
24.331
5.900
MSI GeForce GTX760 Hawk
164.704
24.381
6.158
Sapphire Radeon R9 280 Dual-X
182.414
24.523
6.659
NVIDIA GeForce GTX770
172.309
25.735
6.841
Sapphire Radeon R9 285 ITX Compact
142.150
23.180
6.946
Sapphire Radeon HD7970 DualX OC
169.793
25.025
7.078
MSI GeForce GTX770 Gaming
184.187
26.522
7.277
Gigabyte GeForce GTX770 WF3 OC
181.487
26.319
7.404
Sapphire Radeon R9 280X Toxic
191.693
27.200
8.316
NVIDIA GeForce GTX780
182.525
28.306
8.782
MSI GeForce GTX780 OC Gaming
196.735
28.264
8.847
Sapphire Radeon R9 290
176.401
26.361
9.055
Sapphire Radeon R9 290X
177.493
26.898
9.643
Sapphire Radeon R9 290X Tri-X OC
175.841
27.195
9.899
NVIDIA GeForce GTX780Ti
191.557
29.512
9.901
Inno3D GeForce GTX780 iChill Accelero Hybrid
192.174
29.199
9.946
Sapphire Radeon R9 290X Vapor-X Tri-X OC
170.100
28.822
10.474
MSI GeForce GTX780Ti Gaming
197.913
30.347
10.907
Sapphire Radeon HD7990
198.461
31.582
12.173
Sapphire Radeon HD7970 DualX OC CFX
198.722
31.808
12.187
Sapphire Radeon HD7990 CFX
201.188
36.350
18.952
Test sintetici: 3DMark Fire Strike Extreme–> Menzione a parte merita il benchmark Fire Strike Extreme, parte dell’ultima suite di test della Futuremark, il 3DMark (sì, quello senza numero), i cui requisiti sono davvero estremi e sconsigliati ai deboli di cuore. Tessellazione spinta all’inverosimile, effetti particellari in ogniddove, scintille, nuvole di fumo, fiamme, combattimenti, il tutto in FullHD, ma con un impatto davvero tremendo sulle prestazioni. Poche schede riescono a visualizzare in fluidità un macigno del genere:
3DMark Fire Strike Extreme (Z97)
Bar chart. Data table with 31 rows and 2 columns follows.
3DMark Fire Strike Extreme (Z97)
Marks
Sapphire Radeon R7 250 Ultimate
913
Sapphire Radeon R7 260X OC 2GB
1.900
NVIDIA GeForce GTX750Ti
1.936
ASUS GeForce GTX750Ti DirectCU II OC
2.029
Sapphire Radeon R7 265 Dual-X
2.305
MSI Radeon R9 270 Gaming 2GB
2.634
ASUS Radeon R9 270X DirectCU II TOP
2.873
Gigabyte GeForce GTX760 WF3 OC 4GB
2.907
Sapphire Radeon R9 280 Dual-X
3.290
Sapphire Radeon R9 285 ITX Compact
3.467
MSI GeForce GTX770 Gaming
3.547
Sapphire Radeon HD7970 DualX OC
3.717
Sapphire Radeon R9 280X Toxic
4.156
MSI GeForce GTX780 OC Gaming
4.466
Sapphire Radeon R9 290X
4.574
NVIDIA GeForce GTX780Ti
4.830
Sapphire Radeon R9 290X
4.933
Inno3D GeForce GTX780 iChill Accelero Hybrid
4.977
Sapphire Radeon R9 290X Tri-X OC
5.053
Sapphire Radeon R9 290X Vapor-X Tri-X OC
5.330
MSI GeForce GTX780Ti Gaming
5.361
Inno3D GeForce GTX780 iChill Accelero Hybrid
13.736
NVIDIA GeForce GTX780Ti
13.956
Sapphire Radeon R9 290X
14.006
Sapphire Radeon R9 290X Tri-X OC
14.263
Sapphire Radeon R9 290X Vapor-X Tri-X OC
14.534
MSI GeForce GTX780Ti Gaming
14.832
Sapphire Radeon HD7990
15.047
Sapphire Radeon HD7970 DualX OC CFX
16.360
Sapphire Radeon HD7990 CFX
22.352
Test sintetici: AllBenchmark CatZilla–> Definito da molti come l’Aquamark della next-gen, CatZilla nasce ad opera di una software house semi-sconosciuta (AllBenchmark, divisione software dell’azienda AllPlayer) intenta a portare una ventata di novità nel mondo del testing delle schede video. Il motore grafico proprietario mette in ginocchio tutte le ultime schede in commercio, grazie a gatti giganti (i CatZilla), esplosioni, effetti particellari e musica drum’n’bass che va di pari passo con le scene renderizzate. Il benchmark si avvale delle ultime tecnologie appartenenti alle librerie grafiche DirectX11 e OpenGL 4.2, con quattro diversi preset suddivisi in base alla risoluzione e alla qualità grafica. Noi eseguiremo i tre benchmark:
- 720p
- 1080p
- 1440p
AllBenchmark Catzilla (Z97)
Bar chart. Data table with 31 rows and 4 columns follows.
AllBenchmark Catzilla (Z97)
720p
1080p
1440p
Sapphire Radeon R7 250 Ultimate
4.031
2.191
0
Sapphire Radeon R7 260X OC 2GB
7.330
3.969
2.242
NVIDIA GeForce GTX750Ti
7.533
4.497
2.639
ASUS GeForce GTX750Ti DirectCU II OC
8.534
4.848
2.746
Sapphire Radeon R7 265 Dual-X
8.893
4.982
2.813
MSI Radeon R9 270 Gaming 2GB
9.930
5.684
3.236
ASUS Radeon R9 270X DirectCU II TOP
10.539
6.185
3.524
Sapphire R9 285 ITX Compact
13.013
7.332
3.929
Sapphire Radeon R9 280 Dual-X
11.477
7.044
4.066
Gigabyte GeForce GTX760 WF3 OC 4GB
12.526
7.781
4.698
Sapphire Radeon R9 280X Toxic
14.877
9.089
5.299
Sapphire Radeon R9 290
17.374
10.290
6.004
MSI GeForce GTX770 Gaming
17.870
10.965
6.185
Sapphire Radeon R9 290X
18.052
11.074
6.504
Sapphire Radeon R9 290X Tri-X OC
18.465
11.370
6.699
Sapphire Radeon R9 290X Vapor-X Tri-X OC
18.744
11.895
7.060
MSI GeForce GTX780 OC Gaming
19.596
12.365
7.584
NVIDIA GeForce GTX780Ti
22.471
14.079
8.296
Inno3D GeForce GTX780 iChill Accelero Hybrid
23.627
14.579
8.424
MSI GeForce GTX780Ti Gaming
24.285
15.826
9.590
NVIDIA GeForce GTX780
12.848
14.117
Sapphire Radeon R9 290
13.311
16.206
Inno3D GeForce GTX780 iChill Accelero Hybrid
13.736
14.183
NVIDIA GeForce GTX780Ti
13.956
15.663
Sapphire Radeon R9 290X
14.006
17.398
Sapphire Radeon R9 290X Tri-X OC
14.263
15.793
Sapphire Radeon R9 290X Vapor-X Tri-X OC
14.534
17.384
MSI GeForce GTX780Ti Gaming
14.832
15.698
Sapphire Radeon HD7990
15.047
Sapphire Radeon HD7970 DualX OC CFX
16.360
18.463
Test sui giochi: Thief (2014)–>Nato come reboot di Thief: The dark project, gioco che nel 1998 rivoluzionò le avventure grafiche introducendo luci ed ombre come elementi attivi del gameplay, Thief (2014) è un gioco sviluppato da Eidos Montreal e Square Enix, aziende che l’anno scorso hanno lavorato già ad un altro reboot, anch’esso utilizzato nella nostra suite di test: Tomb Raider. La storia ci catapulta nei panni di Garrett, un abilissimo e ricercatissimo ladro, alle prese con una nuova “setta” che si avvale di poteri magici di potenza incommensurabili, e nel frattempo cercando di salvare una donna molto importante: sua figlia. Tralasciando il filone logico del gioco, esso si avvale dal punto di vista tecnico di un motore grafico che supporta le DirectX11.1, con il feature level di tipo 11_2, avvalendosi del supporto a Mantle, SSAO, Contact Hardening Shadows e Diffusion DOF. Al pari di Bioshock Infinite, viene anche fornito il supporto all’FXAA, antialiasing ad approssimazione rapida, ottimizzato su Shader Model di 5° generazione. Il gioco è ottimizzato per architetture AMD, in quanto parte del programma AMD Gaming Evolved.
Thief (2014)(Z97)
Bar chart. Data table with 31 rows and 4 columns follows.
Thief (2014)(Z97)
1050p
1080p
1440p
ASUS GeForce GTX750Ti DirectCU II OC
49,1
45,2
30,8
Sapphire Radeon R7 265 Dual-X
52,8
48,8
34,5
ASUS Radeon R9 270X DirectCU II TOP
64,5
59,5
42,3
Sapphire Radeon R9 280 Dual-X
66
63,2
45,8
MSI GeForce GTX770 Gaming
79,6
74,1
54,2
Sapphire Radeon R9 285 ITX Compact
78,8
74,6
54,6
Sapphire Radeon R9 280X Toxic
82,4
77,9
58,6
Sapphire Radeon R9 290X
87
84,8
68,2
Inno3D GeForce GTX780 iChill Accelero Hybrid
98,7
94,8
71,6
Sapphire Radeon R9 290X Tri-X OC
92,6
90,1
72,4
Sapphire Radeon R9 290X Vapor-X Tri-X OC
87,3
85,4
76
MSI GeForce GTX780Ti Gaming
88,3
87,8
76,4
Sapphire Radeon HD7970 DualX OC
83,41
73,21
46,67
Sapphire R9 285 ITX Compact
88,6
77,53
48,99
NVIDIA GeForce GTX770
89
78,51
51,49
Sapphire Radeon R9 280X Toxic
92,43
81,61
52,25
Gigabyte GeForce GTX770 WF3 OC
95,1
84,56
54,75
MSI GeForce GTX770 Gaming
99,99
88,78
57,02
Sapphire Radeon R9 290
103,14
91,06
58,82
Sapphire Radeon R9 290X
108,09
95,27
61,69
Sapphire Radeon R9 290X Tri-X OC
109,33
96,72
62,57
NVIDIA GeForce GTX780
106,35
94,92
62,66
Sapphire Radeon R9 290X Vapor-X Tri-X OC
113,82
101,28
65,96
MSI GeForce GTX780 OC Gaming
115,6
102,82
68,68
NVIDIA GeForce GTX780Ti
128,67
114,96
75,15
Inno3D GeForce GTX780 iChill Accelero Hybrid
129,25
115,34
76,36
MSI GeForce GTX780Ti Gaming
138,94
125,53
85,24
Sapphire Radeon HD7970 DualX OC CFX
143,38
128,2
87,35
Sapphire Radeon HD7990
143,95
128,73
87,72
Sapphire Radeon HD7990 CFX
171,33
158,49
114,81
Test sui giochi: Bioshock Infinite–>
Bar chart. Data table with 32 rows and 4 columns follows.
| 1050p | 1080p | 1440p | |
|---|---|---|---|
| Sapphire Radeon R7 265 Dual-X | 0 | 0 | 0 |
| Sapphire Radeon R7 250 Ultimate | 14,5 | 11,9 | 8,1 |
| MSI Radeon HD7790 OC | 23,5 | 19,5 | 13,1 |
| Sapphire Radeon R7 260X OC 2GB | 24,7 | 20,3 | 13,7 |
| NVIDIA GeForce GTX750Ti | 29,2 | 24 | 18,1 |
| ASUS GeForce GTX750Ti DirectCU II OC | 31 | 25,3 | 19,4 |
| MSI Radeon R9 270 Gaming 2GB | 34,4 | 29 | 20,5 |
| ASUS Radeon R9 270X DirectCU II TOP | 37,8 | 31,5 | 21,9 |
| NVIDIA GeForce GTX760 | 40,5 | 36,1 | 22,3 |
| Sapphire Radeon R9 270X Vapor-X | 37,8 | 31,9 | 22,4 |
| Sapphire Radeon R9 280 Dual-X | 41,1 | 34,9 | 26,2 |
| Gigabyte GeForce GTX760 WF3 OC 4GB | 45,4 | 37,8 | 27,6 |
| MSI GeForce GTX760 Hawk | 46,6 | 38,4 | 27,6 |
| Sapphire Radeon R9 285 ITX Compact | 49 | 39,5 | 28,2 |
| Sapphire Radeon HD7970 DualX OC | 44,2 | 37,9 | 28,7 |
| NVIDIA GeForce GTX770 | 53,5 | 43,6 | 31,4 |
| Sapphire Radeon R9 280X Toxic | 52,8 | 44,9 | 33,5 |
| MSI GeForce GTX770 Gaming | 57 | 46,7 | 33,8 |
| Gigabyte GeForce GTX770 WF3 OC | 59 | 48,2 | 34,8 |
| Sapphire Radeon R9 290 | 65,7 | 55,7 | 40 |
| Sapphire Radeon R9 290X | 71,7 | 59,6 | 42,5 |
| Sapphire Radeon R9 290X Tri-X OC | 74,7 | 52,1 | 44,2 |
| NVIDIA GeForce GTX780 | 73,4 | 61,7 | 46,7 |
| Sapphire Radeon R9 290X Vapor-X Tri-X OC | 77,8 | 64,9 | 46,9 |
| MSI GeForce GTX780 OC Gaming | 72,7 | 61,5 | 47 |
| Inno3D GeForce GTX780 iChill Accelero Hybrid | 82,7 | 69,3 | 52,2 |
| Sapphire Radeon HD7990 | 86,6 | 74 | 52,9 |
| NVIDIA GeForce GTX780Ti | 83,9 | 70,8 | 53,6 |
| Sapphire Radeon HD7970 DualX OC CFX | 87,7 | 74,1 | 56,4 |
| MSI GeForce GTX780Ti Gaming | 94,2 | 79 | 60,3 |
| Sapphire Radeon HD7990 CFX | 162,3 | 140,4 | 102,5 |
Bar chart. Data table with 31 rows and 2 columns follows.
| 3DMarks | |
|---|---|
| Sapphire Radeon R7 250 Ultimate | 3.346 |
| NVIDIA GeForce GTX750Ti | 5.699 |
| MSI Radeon HD7790 OC | 6.079 |
| Sapphire Radeon R7 260X OC 2GB | 6.741 |
| Sapphire Radeon R7 265 Dual-X | 7.097 |
| MSI Radeon R9 270 Gaming 2GB | 8.079 |
| NVIDIA GeForce GTX760 | 8.273 |
| Gigabyte GeForce GTX760 WF3 OC 4GB | 8.656 |
| Sapphire Radeon R9 270X Vapor-X | 8.939 |
| ASUS Radeon R9 270X DirectCU II TOP | 9.120 |
| MSI GeForce GTX760 Hawk | 9.294 |
| Sapphire Radeon R9 280 Dual-X | 9.360 |
| Sapphire Radeon HD7970 DualX OC | 9.963 |
| NVIDIA GeForce GTX770 | 10.446 |
| Sapphire Radeon R9 285 ITX Compact | 10.558 |
| MSI GeForce GTX770 Gaming | 11.244 |
| Gigabyte GeForce GTX770 WF3 OC | 11.414 |
| Sapphire Radeon R9 280X Toxic | 11.603 |
| MSI GeForce GTX780 OC Gaming | 12.726 |
| NVIDIA GeForce GTX780 | 12.848 |
| Sapphire Radeon R9 290 | 13.311 |
| Inno3D GeForce GTX780 iChill Accelero Hybrid | 13.736 |
| NVIDIA GeForce GTX780Ti | 13.956 |
| Sapphire Radeon R9 290X | 14.006 |
| Sapphire Radeon R9 290X Tri-X OC | 14.263 |
| Sapphire Radeon R9 290X Vapor-X Tri-X OC | 14.534 |
| MSI GeForce GTX780Ti Gaming | 14.832 |
| Sapphire Radeon HD7990 | 15.047 |
| Sapphire Radeon HD7970 DualX OC CFX | 16.360 |
| Sapphire Radeon HD7990 CFX | 22.352 |
Test sintetici: FutureMark 3DMark–> In concomitanza con il lancio di Windows 8, Futuremark ha lanciato il nuovo 3DMark, chiamato appunto 3DMark, senza alcun numero riconoscitivo, a segnare la forte integrazione che ha con qualsiasi sistema, da Android a Windows a iOS a OSX, dando per la prima volta la possibilità di paragonare le prestazioni su smartphone e PC fisso in maniera schematizzata e professionale. I test di cui si compone sono tre:
- Ice Storm, basato su DirectX9, indicato per computer non recentissimi e sistemi mobile. Con l’ultima patch, è possibile eseguire la versione Extreme, con cui stressare in risoluzione FullHD i tablet ad alta risoluzione/potenza di calcolo.
- Cloud Gate, basato su DirectX10, indicato per computer portatili di recente generazione e GPU anche datate.
- Fire Strike, basato su DirectX11.1, indicato per sistemi desktop ad alte prestazioni. Il benchmark è eseguibile anche in modalità Extreme, che consente di sfruttare a pieno e sforzare i sistemi multi-GPU di fascia alta.
3DMark (Z97)
Bar chart. Data table with 31 rows and 4 columns follows.
3DMark (Z97)
Ice Storm
Cloud Gate
Fire Strike
Sapphire Radeon R7 250 Ultimate
116.514
13.908
2.132
MSI Radeon HD7790 OC
130.573
18.215
3.722
Sapphire Radeon R7 260X OC 2GB
162.417
18.985
3.917
NVIDIA GeForce GTX750Ti
136.161
20.004
3.929
Sapphire Radeon R7 265 Dual-X
176.701
21.892
4.735
MSI Radeon R9 270 Gaming 2GB
180.130
22.463
5.287
NVIDIA GeForce GTX760
159.421
23.409
5.678
Gigabyte GeForce GTX760 WF3 OC 4GB
166.434
23.897
5.773
Sapphire Radeon R9 270X Vapor-X
167.274
23.625
5.825
ASUS Radeon R9 270X DirectCU II TOP
182.333
24.331
5.900
MSI GeForce GTX760 Hawk
164.704
24.381
6.158
Sapphire Radeon R9 280 Dual-X
182.414
24.523
6.659
NVIDIA GeForce GTX770
172.309
25.735
6.841
Sapphire Radeon R9 285 ITX Compact
142.150
23.180
6.946
Sapphire Radeon HD7970 DualX OC
169.793
25.025
7.078
MSI GeForce GTX770 Gaming
184.187
26.522
7.277
Gigabyte GeForce GTX770 WF3 OC
181.487
26.319
7.404
Sapphire Radeon R9 280X Toxic
191.693
27.200
8.316
NVIDIA GeForce GTX780
182.525
28.306
8.782
MSI GeForce GTX780 OC Gaming
196.735
28.264
8.847
Sapphire Radeon R9 290
176.401
26.361
9.055
Sapphire Radeon R9 290X
177.493
26.898
9.643
Sapphire Radeon R9 290X Tri-X OC
175.841
27.195
9.899
NVIDIA GeForce GTX780Ti
191.557
29.512
9.901
Inno3D GeForce GTX780 iChill Accelero Hybrid
192.174
29.199
9.946
Sapphire Radeon R9 290X Vapor-X Tri-X OC
170.100
28.822
10.474
MSI GeForce GTX780Ti Gaming
197.913
30.347
10.907
Sapphire Radeon HD7990
198.461
31.582
12.173
Sapphire Radeon HD7970 DualX OC CFX
198.722
31.808
12.187
Sapphire Radeon HD7990 CFX
201.188
36.350
18.952
Test sintetici: 3DMark Fire Strike Extreme–> Menzione a parte merita il benchmark Fire Strike Extreme, parte dell’ultima suite di test della Futuremark, il 3DMark (sì, quello senza numero), i cui requisiti sono davvero estremi e sconsigliati ai deboli di cuore. Tessellazione spinta all’inverosimile, effetti particellari in ogniddove, scintille, nuvole di fumo, fiamme, combattimenti, il tutto in FullHD, ma con un impatto davvero tremendo sulle prestazioni. Poche schede riescono a visualizzare in fluidità un macigno del genere:
3DMark Fire Strike Extreme (Z97)
Bar chart. Data table with 31 rows and 2 columns follows.
3DMark Fire Strike Extreme (Z97)
Marks
Sapphire Radeon R7 250 Ultimate
913
Sapphire Radeon R7 260X OC 2GB
1.900
NVIDIA GeForce GTX750Ti
1.936
ASUS GeForce GTX750Ti DirectCU II OC
2.029
Sapphire Radeon R7 265 Dual-X
2.305
MSI Radeon R9 270 Gaming 2GB
2.634
ASUS Radeon R9 270X DirectCU II TOP
2.873
Gigabyte GeForce GTX760 WF3 OC 4GB
2.907
Sapphire Radeon R9 280 Dual-X
3.290
Sapphire Radeon R9 285 ITX Compact
3.467
MSI GeForce GTX770 Gaming
3.547
Sapphire Radeon HD7970 DualX OC
3.717
Sapphire Radeon R9 280X Toxic
4.156
MSI GeForce GTX780 OC Gaming
4.466
Sapphire Radeon R9 290X
4.574
NVIDIA GeForce GTX780Ti
4.830
Sapphire Radeon R9 290X
4.933
Inno3D GeForce GTX780 iChill Accelero Hybrid
4.977
Sapphire Radeon R9 290X Tri-X OC
5.053
Sapphire Radeon R9 290X Vapor-X Tri-X OC
5.330
MSI GeForce GTX780Ti Gaming
5.361
Inno3D GeForce GTX780 iChill Accelero Hybrid
13.736
NVIDIA GeForce GTX780Ti
13.956
Sapphire Radeon R9 290X
14.006
Sapphire Radeon R9 290X Tri-X OC
14.263
Sapphire Radeon R9 290X Vapor-X Tri-X OC
14.534
MSI GeForce GTX780Ti Gaming
14.832
Sapphire Radeon HD7990
15.047
Sapphire Radeon HD7970 DualX OC CFX
16.360
Sapphire Radeon HD7990 CFX
22.352
Test sintetici: AllBenchmark CatZilla–> Definito da molti come l’Aquamark della next-gen, CatZilla nasce ad opera di una software house semi-sconosciuta (AllBenchmark, divisione software dell’azienda AllPlayer) intenta a portare una ventata di novità nel mondo del testing delle schede video. Il motore grafico proprietario mette in ginocchio tutte le ultime schede in commercio, grazie a gatti giganti (i CatZilla), esplosioni, effetti particellari e musica drum’n’bass che va di pari passo con le scene renderizzate. Il benchmark si avvale delle ultime tecnologie appartenenti alle librerie grafiche DirectX11 e OpenGL 4.2, con quattro diversi preset suddivisi in base alla risoluzione e alla qualità grafica. Noi eseguiremo i tre benchmark:
- 720p
- 1080p
- 1440p
AllBenchmark Catzilla (Z97)
Bar chart. Data table with 31 rows and 4 columns follows.
AllBenchmark Catzilla (Z97)
720p
1080p
1440p
Sapphire Radeon R7 250 Ultimate
4.031
2.191
0
Sapphire Radeon R7 260X OC 2GB
7.330
3.969
2.242
NVIDIA GeForce GTX750Ti
7.533
4.497
2.639
ASUS GeForce GTX750Ti DirectCU II OC
8.534
4.848
2.746
Sapphire Radeon R7 265 Dual-X
8.893
4.982
2.813
MSI Radeon R9 270 Gaming 2GB
9.930
5.684
3.236
ASUS Radeon R9 270X DirectCU II TOP
10.539
6.185
3.524
Sapphire R9 285 ITX Compact
13.013
7.332
3.929
Sapphire Radeon R9 280 Dual-X
11.477
7.044
4.066
Gigabyte GeForce GTX760 WF3 OC 4GB
12.526
7.781
4.698
Sapphire Radeon R9 280X Toxic
14.877
9.089
5.299
Sapphire Radeon R9 290
17.374
10.290
6.004
MSI GeForce GTX770 Gaming
17.870
10.965
6.185
Sapphire Radeon R9 290X
18.052
11.074
6.504
Sapphire Radeon R9 290X Tri-X OC
18.465
11.370
6.699
Sapphire Radeon R9 290X Vapor-X Tri-X OC
18.744
11.895
7.060
MSI GeForce GTX780 OC Gaming
19.596
12.365
7.584
NVIDIA GeForce GTX780Ti
22.471
14.079
8.296
Inno3D GeForce GTX780 iChill Accelero Hybrid
23.627
14.579
8.424
MSI GeForce GTX780Ti Gaming
24.285
15.826
9.590
NVIDIA GeForce GTX780
12.848
14.117
Sapphire Radeon R9 290
13.311
16.206
Inno3D GeForce GTX780 iChill Accelero Hybrid
13.736
14.183
NVIDIA GeForce GTX780Ti
13.956
15.663
Sapphire Radeon R9 290X
14.006
17.398
Sapphire Radeon R9 290X Tri-X OC
14.263
15.793
Sapphire Radeon R9 290X Vapor-X Tri-X OC
14.534
17.384
MSI GeForce GTX780Ti Gaming
14.832
15.698
Sapphire Radeon HD7990
15.047
Sapphire Radeon HD7970 DualX OC CFX
16.360
18.463
Test sui giochi: Thief (2014)–>Nato come reboot di Thief: The dark project, gioco che nel 1998 rivoluzionò le avventure grafiche introducendo luci ed ombre come elementi attivi del gameplay, Thief (2014) è un gioco sviluppato da Eidos Montreal e Square Enix, aziende che l’anno scorso hanno lavorato già ad un altro reboot, anch’esso utilizzato nella nostra suite di test: Tomb Raider. La storia ci catapulta nei panni di Garrett, un abilissimo e ricercatissimo ladro, alle prese con una nuova “setta” che si avvale di poteri magici di potenza incommensurabili, e nel frattempo cercando di salvare una donna molto importante: sua figlia. Tralasciando il filone logico del gioco, esso si avvale dal punto di vista tecnico di un motore grafico che supporta le DirectX11.1, con il feature level di tipo 11_2, avvalendosi del supporto a Mantle, SSAO, Contact Hardening Shadows e Diffusion DOF. Al pari di Bioshock Infinite, viene anche fornito il supporto all’FXAA, antialiasing ad approssimazione rapida, ottimizzato su Shader Model di 5° generazione. Il gioco è ottimizzato per architetture AMD, in quanto parte del programma AMD Gaming Evolved.
Thief (2014)(Z97)
Bar chart. Data table with 31 rows and 4 columns follows.
Thief (2014)(Z97)
1050p
1080p
1440p
ASUS GeForce GTX750Ti DirectCU II OC
49,1
45,2
30,8
Sapphire Radeon R7 265 Dual-X
52,8
48,8
34,5
ASUS Radeon R9 270X DirectCU II TOP
64,5
59,5
42,3
Sapphire Radeon R9 280 Dual-X
66
63,2
45,8
MSI GeForce GTX770 Gaming
79,6
74,1
54,2
Sapphire Radeon R9 285 ITX Compact
78,8
74,6
54,6
Sapphire Radeon R9 280X Toxic
82,4
77,9
58,6
Sapphire Radeon R9 290X
87
84,8
68,2
Inno3D GeForce GTX780 iChill Accelero Hybrid
98,7
94,8
71,6
Sapphire Radeon R9 290X Tri-X OC
92,6
90,1
72,4
Sapphire Radeon R9 290X Vapor-X Tri-X OC
87,3
85,4
76
MSI GeForce GTX780Ti Gaming
88,3
87,8
76,4
Sapphire Radeon HD7970 DualX OC
83,41
73,21
46,67
Sapphire R9 285 ITX Compact
88,6
77,53
48,99
NVIDIA GeForce GTX770
89
78,51
51,49
Sapphire Radeon R9 280X Toxic
92,43
81,61
52,25
Gigabyte GeForce GTX770 WF3 OC
95,1
84,56
54,75
MSI GeForce GTX770 Gaming
99,99
88,78
57,02
Sapphire Radeon R9 290
103,14
91,06
58,82
Sapphire Radeon R9 290X
108,09
95,27
61,69
Sapphire Radeon R9 290X Tri-X OC
109,33
96,72
62,57
NVIDIA GeForce GTX780
106,35
94,92
62,66
Sapphire Radeon R9 290X Vapor-X Tri-X OC
113,82
101,28
65,96
MSI GeForce GTX780 OC Gaming
115,6
102,82
68,68
NVIDIA GeForce GTX780Ti
128,67
114,96
75,15
Inno3D GeForce GTX780 iChill Accelero Hybrid
129,25
115,34
76,36
MSI GeForce GTX780Ti Gaming
138,94
125,53
85,24
Sapphire Radeon HD7970 DualX OC CFX
143,38
128,2
87,35
Sapphire Radeon HD7990
143,95
128,73
87,72
Sapphire Radeon HD7990 CFX
171,33
158,49
114,81
Test sui giochi: Bioshock Infinite–>
Bar chart. Data table with 31 rows and 4 columns follows.
| Ice Storm | Cloud Gate | Fire Strike | |
|---|---|---|---|
| Sapphire Radeon R7 250 Ultimate | 116.514 | 13.908 | 2.132 |
| MSI Radeon HD7790 OC | 130.573 | 18.215 | 3.722 |
| Sapphire Radeon R7 260X OC 2GB | 162.417 | 18.985 | 3.917 |
| NVIDIA GeForce GTX750Ti | 136.161 | 20.004 | 3.929 |
| Sapphire Radeon R7 265 Dual-X | 176.701 | 21.892 | 4.735 |
| MSI Radeon R9 270 Gaming 2GB | 180.130 | 22.463 | 5.287 |
| NVIDIA GeForce GTX760 | 159.421 | 23.409 | 5.678 |
| Gigabyte GeForce GTX760 WF3 OC 4GB | 166.434 | 23.897 | 5.773 |
| Sapphire Radeon R9 270X Vapor-X | 167.274 | 23.625 | 5.825 |
| ASUS Radeon R9 270X DirectCU II TOP | 182.333 | 24.331 | 5.900 |
| MSI GeForce GTX760 Hawk | 164.704 | 24.381 | 6.158 |
| Sapphire Radeon R9 280 Dual-X | 182.414 | 24.523 | 6.659 |
| NVIDIA GeForce GTX770 | 172.309 | 25.735 | 6.841 |
| Sapphire Radeon R9 285 ITX Compact | 142.150 | 23.180 | 6.946 |
| Sapphire Radeon HD7970 DualX OC | 169.793 | 25.025 | 7.078 |
| MSI GeForce GTX770 Gaming | 184.187 | 26.522 | 7.277 |
| Gigabyte GeForce GTX770 WF3 OC | 181.487 | 26.319 | 7.404 |
| Sapphire Radeon R9 280X Toxic | 191.693 | 27.200 | 8.316 |
| NVIDIA GeForce GTX780 | 182.525 | 28.306 | 8.782 |
| MSI GeForce GTX780 OC Gaming | 196.735 | 28.264 | 8.847 |
| Sapphire Radeon R9 290 | 176.401 | 26.361 | 9.055 |
| Sapphire Radeon R9 290X | 177.493 | 26.898 | 9.643 |
| Sapphire Radeon R9 290X Tri-X OC | 175.841 | 27.195 | 9.899 |
| NVIDIA GeForce GTX780Ti | 191.557 | 29.512 | 9.901 |
| Inno3D GeForce GTX780 iChill Accelero Hybrid | 192.174 | 29.199 | 9.946 |
| Sapphire Radeon R9 290X Vapor-X Tri-X OC | 170.100 | 28.822 | 10.474 |
| MSI GeForce GTX780Ti Gaming | 197.913 | 30.347 | 10.907 |
| Sapphire Radeon HD7990 | 198.461 | 31.582 | 12.173 |
| Sapphire Radeon HD7970 DualX OC CFX | 198.722 | 31.808 | 12.187 |
| Sapphire Radeon HD7990 CFX | 201.188 | 36.350 | 18.952 |
Bar chart. Data table with 31 rows and 2 columns follows.
| Marks | |
|---|---|
| Sapphire Radeon R7 250 Ultimate | 913 |
| Sapphire Radeon R7 260X OC 2GB | 1.900 |
| NVIDIA GeForce GTX750Ti | 1.936 |
| ASUS GeForce GTX750Ti DirectCU II OC | 2.029 |
| Sapphire Radeon R7 265 Dual-X | 2.305 |
| MSI Radeon R9 270 Gaming 2GB | 2.634 |
| ASUS Radeon R9 270X DirectCU II TOP | 2.873 |
| Gigabyte GeForce GTX760 WF3 OC 4GB | 2.907 |
| Sapphire Radeon R9 280 Dual-X | 3.290 |
| Sapphire Radeon R9 285 ITX Compact | 3.467 |
| MSI GeForce GTX770 Gaming | 3.547 |
| Sapphire Radeon HD7970 DualX OC | 3.717 |
| Sapphire Radeon R9 280X Toxic | 4.156 |
| MSI GeForce GTX780 OC Gaming | 4.466 |
| Sapphire Radeon R9 290X | 4.574 |
| NVIDIA GeForce GTX780Ti | 4.830 |
| Sapphire Radeon R9 290X | 4.933 |
| Inno3D GeForce GTX780 iChill Accelero Hybrid | 4.977 |
| Sapphire Radeon R9 290X Tri-X OC | 5.053 |
| Sapphire Radeon R9 290X Vapor-X Tri-X OC | 5.330 |
| MSI GeForce GTX780Ti Gaming | 5.361 |
| Inno3D GeForce GTX780 iChill Accelero Hybrid | 13.736 |
| NVIDIA GeForce GTX780Ti | 13.956 |
| Sapphire Radeon R9 290X | 14.006 |
| Sapphire Radeon R9 290X Tri-X OC | 14.263 |
| Sapphire Radeon R9 290X Vapor-X Tri-X OC | 14.534 |
| MSI GeForce GTX780Ti Gaming | 14.832 |
| Sapphire Radeon HD7990 | 15.047 |
| Sapphire Radeon HD7970 DualX OC CFX | 16.360 |
| Sapphire Radeon HD7990 CFX | 22.352 |
Test sintetici: AllBenchmark CatZilla–> Definito da molti come l’Aquamark della next-gen, CatZilla nasce ad opera di una software house semi-sconosciuta (AllBenchmark, divisione software dell’azienda AllPlayer) intenta a portare una ventata di novità nel mondo del testing delle schede video. Il motore grafico proprietario mette in ginocchio tutte le ultime schede in commercio, grazie a gatti giganti (i CatZilla), esplosioni, effetti particellari e musica drum’n’bass che va di pari passo con le scene renderizzate. Il benchmark si avvale delle ultime tecnologie appartenenti alle librerie grafiche DirectX11 e OpenGL 4.2, con quattro diversi preset suddivisi in base alla risoluzione e alla qualità grafica. Noi eseguiremo i tre benchmark:
- 720p
- 1080p
- 1440p
AllBenchmark Catzilla (Z97)
Bar chart. Data table with 31 rows and 4 columns follows.
AllBenchmark Catzilla (Z97)
720p
1080p
1440p
Sapphire Radeon R7 250 Ultimate
4.031
2.191
0
Sapphire Radeon R7 260X OC 2GB
7.330
3.969
2.242
NVIDIA GeForce GTX750Ti
7.533
4.497
2.639
ASUS GeForce GTX750Ti DirectCU II OC
8.534
4.848
2.746
Sapphire Radeon R7 265 Dual-X
8.893
4.982
2.813
MSI Radeon R9 270 Gaming 2GB
9.930
5.684
3.236
ASUS Radeon R9 270X DirectCU II TOP
10.539
6.185
3.524
Sapphire R9 285 ITX Compact
13.013
7.332
3.929
Sapphire Radeon R9 280 Dual-X
11.477
7.044
4.066
Gigabyte GeForce GTX760 WF3 OC 4GB
12.526
7.781
4.698
Sapphire Radeon R9 280X Toxic
14.877
9.089
5.299
Sapphire Radeon R9 290
17.374
10.290
6.004
MSI GeForce GTX770 Gaming
17.870
10.965
6.185
Sapphire Radeon R9 290X
18.052
11.074
6.504
Sapphire Radeon R9 290X Tri-X OC
18.465
11.370
6.699
Sapphire Radeon R9 290X Vapor-X Tri-X OC
18.744
11.895
7.060
MSI GeForce GTX780 OC Gaming
19.596
12.365
7.584
NVIDIA GeForce GTX780Ti
22.471
14.079
8.296
Inno3D GeForce GTX780 iChill Accelero Hybrid
23.627
14.579
8.424
MSI GeForce GTX780Ti Gaming
24.285
15.826
9.590
NVIDIA GeForce GTX780
12.848
14.117
Sapphire Radeon R9 290
13.311
16.206
Inno3D GeForce GTX780 iChill Accelero Hybrid
13.736
14.183
NVIDIA GeForce GTX780Ti
13.956
15.663
Sapphire Radeon R9 290X
14.006
17.398
Sapphire Radeon R9 290X Tri-X OC
14.263
15.793
Sapphire Radeon R9 290X Vapor-X Tri-X OC
14.534
17.384
MSI GeForce GTX780Ti Gaming
14.832
15.698
Sapphire Radeon HD7990
15.047
Sapphire Radeon HD7970 DualX OC CFX
16.360
18.463
Test sui giochi: Thief (2014)–>Nato come reboot di Thief: The dark project, gioco che nel 1998 rivoluzionò le avventure grafiche introducendo luci ed ombre come elementi attivi del gameplay, Thief (2014) è un gioco sviluppato da Eidos Montreal e Square Enix, aziende che l’anno scorso hanno lavorato già ad un altro reboot, anch’esso utilizzato nella nostra suite di test: Tomb Raider. La storia ci catapulta nei panni di Garrett, un abilissimo e ricercatissimo ladro, alle prese con una nuova “setta” che si avvale di poteri magici di potenza incommensurabili, e nel frattempo cercando di salvare una donna molto importante: sua figlia. Tralasciando il filone logico del gioco, esso si avvale dal punto di vista tecnico di un motore grafico che supporta le DirectX11.1, con il feature level di tipo 11_2, avvalendosi del supporto a Mantle, SSAO, Contact Hardening Shadows e Diffusion DOF. Al pari di Bioshock Infinite, viene anche fornito il supporto all’FXAA, antialiasing ad approssimazione rapida, ottimizzato su Shader Model di 5° generazione. Il gioco è ottimizzato per architetture AMD, in quanto parte del programma AMD Gaming Evolved.
Thief (2014)(Z97)
Bar chart. Data table with 31 rows and 4 columns follows.
Thief (2014)(Z97)
1050p
1080p
1440p
ASUS GeForce GTX750Ti DirectCU II OC
49,1
45,2
30,8
Sapphire Radeon R7 265 Dual-X
52,8
48,8
34,5
ASUS Radeon R9 270X DirectCU II TOP
64,5
59,5
42,3
Sapphire Radeon R9 280 Dual-X
66
63,2
45,8
MSI GeForce GTX770 Gaming
79,6
74,1
54,2
Sapphire Radeon R9 285 ITX Compact
78,8
74,6
54,6
Sapphire Radeon R9 280X Toxic
82,4
77,9
58,6
Sapphire Radeon R9 290X
87
84,8
68,2
Inno3D GeForce GTX780 iChill Accelero Hybrid
98,7
94,8
71,6
Sapphire Radeon R9 290X Tri-X OC
92,6
90,1
72,4
Sapphire Radeon R9 290X Vapor-X Tri-X OC
87,3
85,4
76
MSI GeForce GTX780Ti Gaming
88,3
87,8
76,4
Sapphire Radeon HD7970 DualX OC
83,41
73,21
46,67
Sapphire R9 285 ITX Compact
88,6
77,53
48,99
NVIDIA GeForce GTX770
89
78,51
51,49
Sapphire Radeon R9 280X Toxic
92,43
81,61
52,25
Gigabyte GeForce GTX770 WF3 OC
95,1
84,56
54,75
MSI GeForce GTX770 Gaming
99,99
88,78
57,02
Sapphire Radeon R9 290
103,14
91,06
58,82
Sapphire Radeon R9 290X
108,09
95,27
61,69
Sapphire Radeon R9 290X Tri-X OC
109,33
96,72
62,57
NVIDIA GeForce GTX780
106,35
94,92
62,66
Sapphire Radeon R9 290X Vapor-X Tri-X OC
113,82
101,28
65,96
MSI GeForce GTX780 OC Gaming
115,6
102,82
68,68
NVIDIA GeForce GTX780Ti
128,67
114,96
75,15
Inno3D GeForce GTX780 iChill Accelero Hybrid
129,25
115,34
76,36
MSI GeForce GTX780Ti Gaming
138,94
125,53
85,24
Sapphire Radeon HD7970 DualX OC CFX
143,38
128,2
87,35
Sapphire Radeon HD7990
143,95
128,73
87,72
Sapphire Radeon HD7990 CFX
171,33
158,49
114,81
Test sui giochi: Bioshock Infinite–>
Bar chart. Data table with 31 rows and 4 columns follows.
| 720p | 1080p | 1440p | |
|---|---|---|---|
| Sapphire Radeon R7 250 Ultimate | 4.031 | 2.191 | 0 |
| Sapphire Radeon R7 260X OC 2GB | 7.330 | 3.969 | 2.242 |
| NVIDIA GeForce GTX750Ti | 7.533 | 4.497 | 2.639 |
| ASUS GeForce GTX750Ti DirectCU II OC | 8.534 | 4.848 | 2.746 |
| Sapphire Radeon R7 265 Dual-X | 8.893 | 4.982 | 2.813 |
| MSI Radeon R9 270 Gaming 2GB | 9.930 | 5.684 | 3.236 |
| ASUS Radeon R9 270X DirectCU II TOP | 10.539 | 6.185 | 3.524 |
| Sapphire R9 285 ITX Compact | 13.013 | 7.332 | 3.929 |
| Sapphire Radeon R9 280 Dual-X | 11.477 | 7.044 | 4.066 |
| Gigabyte GeForce GTX760 WF3 OC 4GB | 12.526 | 7.781 | 4.698 |
| Sapphire Radeon R9 280X Toxic | 14.877 | 9.089 | 5.299 |
| Sapphire Radeon R9 290 | 17.374 | 10.290 | 6.004 |
| MSI GeForce GTX770 Gaming | 17.870 | 10.965 | 6.185 |
| Sapphire Radeon R9 290X | 18.052 | 11.074 | 6.504 |
| Sapphire Radeon R9 290X Tri-X OC | 18.465 | 11.370 | 6.699 |
| Sapphire Radeon R9 290X Vapor-X Tri-X OC | 18.744 | 11.895 | 7.060 |
| MSI GeForce GTX780 OC Gaming | 19.596 | 12.365 | 7.584 |
| NVIDIA GeForce GTX780Ti | 22.471 | 14.079 | 8.296 |
| Inno3D GeForce GTX780 iChill Accelero Hybrid | 23.627 | 14.579 | 8.424 |
| MSI GeForce GTX780Ti Gaming | 24.285 | 15.826 | 9.590 |
| NVIDIA GeForce GTX780 | 12.848 | 14.117 | |
| Sapphire Radeon R9 290 | 13.311 | 16.206 | |
| Inno3D GeForce GTX780 iChill Accelero Hybrid | 13.736 | 14.183 | |
| NVIDIA GeForce GTX780Ti | 13.956 | 15.663 | |
| Sapphire Radeon R9 290X | 14.006 | 17.398 | |
| Sapphire Radeon R9 290X Tri-X OC | 14.263 | 15.793 | |
| Sapphire Radeon R9 290X Vapor-X Tri-X OC | 14.534 | 17.384 | |
| MSI GeForce GTX780Ti Gaming | 14.832 | 15.698 | |
| Sapphire Radeon HD7990 | 15.047 | ||
| Sapphire Radeon HD7970 DualX OC CFX | 16.360 | 18.463 |
Bar chart. Data table with 31 rows and 4 columns follows.
| 1050p | 1080p | 1440p | |
|---|---|---|---|
| ASUS GeForce GTX750Ti DirectCU II OC | 49,1 | 45,2 | 30,8 |
| Sapphire Radeon R7 265 Dual-X | 52,8 | 48,8 | 34,5 |
| ASUS Radeon R9 270X DirectCU II TOP | 64,5 | 59,5 | 42,3 |
| Sapphire Radeon R9 280 Dual-X | 66 | 63,2 | 45,8 |
| MSI GeForce GTX770 Gaming | 79,6 | 74,1 | 54,2 |
| Sapphire Radeon R9 285 ITX Compact | 78,8 | 74,6 | 54,6 |
| Sapphire Radeon R9 280X Toxic | 82,4 | 77,9 | 58,6 |
| Sapphire Radeon R9 290X | 87 | 84,8 | 68,2 |
| Inno3D GeForce GTX780 iChill Accelero Hybrid | 98,7 | 94,8 | 71,6 |
| Sapphire Radeon R9 290X Tri-X OC | 92,6 | 90,1 | 72,4 |
| Sapphire Radeon R9 290X Vapor-X Tri-X OC | 87,3 | 85,4 | 76 |
| MSI GeForce GTX780Ti Gaming | 88,3 | 87,8 | 76,4 |
| Sapphire Radeon HD7970 DualX OC | 83,41 | 73,21 | 46,67 |
| Sapphire R9 285 ITX Compact | 88,6 | 77,53 | 48,99 |
| NVIDIA GeForce GTX770 | 89 | 78,51 | 51,49 |
| Sapphire Radeon R9 280X Toxic | 92,43 | 81,61 | 52,25 |
| Gigabyte GeForce GTX770 WF3 OC | 95,1 | 84,56 | 54,75 |
| MSI GeForce GTX770 Gaming | 99,99 | 88,78 | 57,02 |
| Sapphire Radeon R9 290 | 103,14 | 91,06 | 58,82 |
| Sapphire Radeon R9 290X | 108,09 | 95,27 | 61,69 |
| Sapphire Radeon R9 290X Tri-X OC | 109,33 | 96,72 | 62,57 |
| NVIDIA GeForce GTX780 | 106,35 | 94,92 | 62,66 |
| Sapphire Radeon R9 290X Vapor-X Tri-X OC | 113,82 | 101,28 | 65,96 |
| MSI GeForce GTX780 OC Gaming | 115,6 | 102,82 | 68,68 |
| NVIDIA GeForce GTX780Ti | 128,67 | 114,96 | 75,15 |
| Inno3D GeForce GTX780 iChill Accelero Hybrid | 129,25 | 115,34 | 76,36 |
| MSI GeForce GTX780Ti Gaming | 138,94 | 125,53 | 85,24 |
| Sapphire Radeon HD7970 DualX OC CFX | 143,38 | 128,2 | 87,35 |
| Sapphire Radeon HD7990 | 143,95 | 128,73 | 87,72 |
| Sapphire Radeon HD7990 CFX | 171,33 | 158,49 | 114,81 |
Test sui giochi: Bioshock Infinite–>
Continuiamo con Bioshock Infinite, che ci mette nei panni di Booker DeWitt, un investigatore privato, un tempo agente Pinkerton, incaricato di ritrovare una ragazza, Elizabeth, tenuta prigioniera a Columbia, una fantomatica città sospesa nei cieli, dove le modifiche genetiche sono considerate veri e propri beni di lusso. Per la prima volta nella serie di Bioshock, il personaggio ha un volto, un nome ed una storia precedente al gioco, che verrà svelata con l’avanzare della partita. Il gioco supporta le API DirectX 11, con le quali supporta tecnologie quali: High Definition Ambient Occlusion, Contact Hardening Shadows e Diffusion Depth of Field. È implementato inoltre il supporto all’FXAA (anti-aliasing ad approssimazione rapida) ottimizzato per l’utilizzo su SM 5.0. Il gioco è ottimizzato per architetture AMD, in quanto parte del programma AMD Gaming Evolved.
Bar chart. Data table with 31 rows and 4 columns follows.
| 1050p | 1080p | 1440p | |
|---|---|---|---|
| Sapphire Radeon R7 250 Ultimate | 24 | 20,8 | 12,53 |
| Sapphire Radeon R7 260X OC 2GB | 42,34 | 36,87 | 22,29 |
| NVIDIA GeForce GTX750Ti | 51,53 | 45,21 | 28,14 |
| Sapphire Radeon R7 265 Dual-X | 53,35 | 46,61 | 28,87 |
| ASUS GeForce GTX750Ti DirectCU II OC | 56,25 | 49,14 | 29,98 |
| MSI Radeon R9 270 Gaming 2GB | 58,64 | 51,2 | 32,16 |
| Sapphire Radeon R9 270X Vapor-X | 63,34 | 55,2 | 34,17 |
| ASUS Radeon R9 270X DirectCU II TOP | 65,16 | 56,5 | 34,56 |
| NVIDIA GeForce GTX760 | 60,5 | 57,69 | 36,78 |
| Sapphire Radeon R9 280 Dual-X | 72,53 | 63,77 | 40,71 |
| Gigabyte GeForce GTX760 WF3 OC 4GB | 74,64 | 66 | 42,42 |
| MSI GeForce GTX760 Hawk | 78,94 | 69,74 | 44,5 |
| Sapphire Radeon HD7970 DualX OC | 83,41 | 73,21 | 46,67 |
| Sapphire R9 285 ITX Compact | 88,6 | 77,53 | 48,99 |
| NVIDIA GeForce GTX770 | 89 | 78,51 | 51,49 |
| Sapphire Radeon R9 280X Toxic | 92,43 | 81,61 | 52,25 |
| Gigabyte GeForce GTX770 WF3 OC | 95,1 | 84,56 | 54,75 |
| MSI GeForce GTX770 Gaming | 99,99 | 88,78 | 57,02 |
| Sapphire Radeon R9 290 | 103,14 | 91,06 | 58,82 |
| Sapphire Radeon R9 290X | 108,09 | 95,27 | 61,69 |
| Sapphire Radeon R9 290X Tri-X OC | 109,33 | 96,72 | 62,57 |
| NVIDIA GeForce GTX780 | 106,35 | 94,92 | 62,66 |
| Sapphire Radeon R9 290X Vapor-X Tri-X OC | 113,82 | 101,28 | 65,96 |
| MSI GeForce GTX780 OC Gaming | 115,6 | 102,82 | 68,68 |
| NVIDIA GeForce GTX780Ti | 128,67 | 114,96 | 75,15 |
| Inno3D GeForce GTX780 iChill Accelero Hybrid | 129,25 | 115,34 | 76,36 |
| MSI GeForce GTX780Ti Gaming | 138,94 | 125,53 | 85,24 |
| Sapphire Radeon HD7970 DualX OC CFX | 143,38 | 128,2 | 87,35 |
| Sapphire Radeon HD7990 | 143,95 | 128,73 | 87,72 |
| Sapphire Radeon HD7990 CFX | 171,33 | 158,49 | 114,81 |
Test sui giochi: Batman: Arkham Origins–>Chiunque sia appassionato di comics o fumetti, non può non conoscere Bruce Wayne, alias Batman, che ha visto prendere negli ultimi 3 anni la trilogia di Arkham, dapprima in un manicomio, poi al centro di Gotham City, per poi far capolino alle origini, con il terzo capitolo che fa da sequel a tutta la serie. In Batman: Arkham Origins, il cavaliere oscuro è più buio di quanto ci si possa aspettare. Un Bruce Wayne sfrontato, sicuro (troppo) di sé e altezzoso come non ce lo saremmo mai immaginati: il cavaliere oscuro, ancora più oscuro. Tecnicamente parlando, insieme ad Assassin’s Creed IV: Black Flag, è l’ultimo gioco NVIDIA in quanto a tecnologie implementate e supporto al programma NVIDIA – The Way It’s Meant To Be Played, con il supporto a HBAO+, PhysX, Apex e FXAA ad impatto prestazionale ridotto.
Batman: Arkham Origins (Z97)
Bar chart. Data table with 20 rows and 4 columns follows.
Batman: Arkham Origins (Z97)
1050p
1080p
1440p
ASUS GeForce GTX750Ti DirectCU II OC
0
0
0
Sapphire Radeon R7 250 Ultimate
34
29
17
Sapphire Radeon R7 260X OC 2GB
45
42
32
NVIDIA GeForce GTX750Ti
73
67
40
Sapphire Radeon R7 265 Dual-X
69
66
42
MSI Radeon R9 270 Gaming 2GB
63
58
45
Sapphire Radeon R9 280 Dual-X
74
70
53
Sapphire R9 285 ITX Compact
95
87
62
ASUS Radeon R9 270X DirectCU II TOP
87
77
63
Gigabyte GeForce GTX760 WF3 OC 4GB
117
100
67
Sapphire Radeon R9 280X Toxic
111
101
71
Sapphire Radeon R9 290
122
111
76
Sapphire Radeon R9 290X
129
116
81
Sapphire Radeon R9 290X Tri-X OC
133
119
84
MSI GeForce GTX770 Gaming
149
136
87
Sapphire Radeon R9 290X Vapor-X Tri-X OC
115
108
88
MSI GeForce GTX780 OC Gaming
146
133
103
Inno3D GeForce GTX780 iChill Accelero Hybrid
164
156
118
MSI GeForce GTX780Ti Gaming
182
167
125
Test sui giochi: Metro Last Light–> Dopo l’incredibile successo di Metro 2033, ecco che quest’anno ha fatto capolino sugli schermi dei nostri PC il successore, Metro Last Light, basato sul romanzo Metro 2034 di Dmitry Glukhovsky, che vede il mondo alle prese con i postumi di una terza guerra mondiale atomica, con tutto ciò che ne consegue: la popolazione ancora in vita in Russia si è trasferita nella famigerata metropolitana russa, dotata di 298 km di binari e tunnel sotto Mosca. Ancora una volta, il giocatore rivestirà i panni di Artyom, per impedire una guerra civile che potrebbe portare alla fine il genere umano. Tecnicamente parlando, il gioco è incredibilmente pesante, sia per poligoni a schermo che per requisiti, facendo uso di tutte le tecnologie introdotte dalle DirectX11: Depth of Field, HDAO, Tessellation e real-time Motion Blur. Il gioco è ottimizzato per schede video NVIDIA, dato il supporto all’NVIDIA PhysX e in quanto parte del programma NVIDIA – The Way It’s Meant To Be Played.
Metro Last Light (Z97)
Bar chart. Data table with 31 rows and 4 columns follows.
Metro Last Light (Z97)
1050p
1080p
1440p
Sapphire Radeon R7 250 Ultimate
17,14
14,84
9,49
Sapphire Radeon R7 260X OC 2GB
26,32
23,95
17,6
NVIDIA GeForce GTX750Ti
33,29
29,51
18,73
ASUS GeForce GTX750Ti DirectCU II OC
36,56
32,51
20,62
Sapphire Radeon R7 265 Dual-X
37,5
33,51
21,91
NVIDIA GeForce GTX760
39,7
30,57
22,13
MSI Radeon R9 270 Gaming 2GB
41,85
37
24
ASUS Radeon R9 270X DirectCU II TOP
47,97
42,83
27,3
Sapphire Radeon R9 270X Vapor-X
46,92
42,04
27,53
Gigabyte GeForce GTX760 WF3 OC 4GB
48,45
43,99
29,63
MSI GeForce GTX760 Hawk
51,89
46,82
31,6
Sapphire Radeon R9 280 Dual-X
52,14
46,92
32,16
Sapphire Radeon R9 285 ITX Compact
60,02
53,43
34,61
Sapphire Radeon HD7970 DualX OC
56,22
51,06
35,28
NVIDIA GeForce GTX770
59,01
52,73
35,55
Gigabyte GeForce GTX770 WF3 OC
64,03
58,1
39,27
MSI GeForce GTX770 Gaming
66,22
60,07
39,46
Sapphire Radeon R9 280X Toxic
65,78
59,34
40,79
NVIDIA GeForce GTX780
66,58
60,56
43,1
Sapphire Radeon R9 290
76,73
68,67
46,49
MSI GeForce GTX780 OC Gaming
74,79
68,44
47,95
Sapphire Radeon HD7990
78
68
51
Sapphire Radeon R9 290X
83,12
74,48
51,67
Sapphire Radeon R9 290X Tri-X OC
86,26
77,59
53,47
NVIDIA GeForce GTX780Ti
86,53
77,68
53,54
Inno3D GeForce GTX780 iChill Accelero Hybrid
85,71
78,2
53,76
Sapphire Radeon R9 290X Vapor-X Tri-X OC
90,92
81,15
54,9
Sapphire Radeon HD7990 CFX
78,5
73,67
56,05
Sapphire Radeon HD7970 DualX OC CFX
83,06
77,56
57,69
Sapphire Radeon HD7990 CFX
171,33
158,49
114,81
Test sui giochi: Tomb Raider (2013)–> Lara Croft. Chiunque abbia un minimo di conoscenza videoludica sa chi si nasconde dietro questo nome: la formosa cacciatrice di tesori intorno alla quale è incentrata la serie Tomb Raider. Nel capitolo che ha visto la luce quest’anno, viene effettuato un vero e proprio fast backward, approfittando di un “reboot” della serie per mostrare al giocatore una Lara Croft appena laureata e alle prese con la sua prima avventura. Ovviamente, le forme (e sì, anche l’avventura) non mancano. Il gioco supporta le DirectX11.1, con il feature level di tipo 11_1, le cui istruzioni vengono utilizzate dal TressFX, tecnologia open source che permette di renderizzare i capelli in maniera più realistica, e se supportata dall’hardware, senza un impatto consistente sulle prestazioni. Il motore grafico utilizzato è proprietario di Crystal Dynamics, e consente di scalare discretamente su macchine di potenza diversa senza influire troppo negativamente sull’aspetto delle texture. Il gioco è ottimizzato per architetture AMD, in quanto parte del programma AMD Gaming Evolved.
Tomb Raider (2013)(Z97)
Bar chart. Data table with 31 rows and 4 columns follows.
Tomb Raider (2013)(Z97)
1050p
1080p
1440p
Sapphire Radeon R7 250 Ultimate
29,2
25,8
15,3
ASUS GeForce GTX750Ti DirectCU II OC
52,6
46,8
28,8
NVIDIA GeForce GTX750Ti
53
47,7
29,4
Sapphire Radeon R7 260X OC 2GB
54,1
48,4
29,7
Sapphire Radeon R7 265 Dual-X
60,4
54,3
33,3
NVIDIA GeForce GTX760
80,6
60,5
41,5
MSI Radeon R9 270 Gaming 2GB
76,8
68,44
42,9
Sapphire Radeon R9 270X Vapor-X
82,6
75,2
46,3
Gigabyte GeForce GTX760 WF3 OC 4GB
84,6
76,2
48,6
ASUS Radeon R9 270X DirectCU II TOP
87,9
79,2
49,1
Sapphire Radeon R9 280 Dual-X
85,2
76,3
49,3
Sapphire Radeon R9 285 ITX Compact
87,9
78,9
50,4
MSI GeForce GTX760 Hawk
90,1
81,3
50,9
NVIDIA GeForce GTX770
92,5
82,2
53,8
MSI GeForce GTX770 Gaming
103
91,2
57,9
Sapphire Radeon HD7970 DualX OC
99,5
90,9
59,5
Gigabyte GeForce GTX770 WF3 OC
114,5
101,5
64,6
Sapphire Radeon R9 280X Toxic
113,1
103,5
66,1
NVIDIA GeForce GTX780
119,3
107,1
68,3
MSI GeForce GTX780 OC Gaming
132,6
119,8
78,2
Sapphire Radeon R9 290
137,8
123,6
79,5
Inno3D GeForce GTX780 iChill Accelero Hybrid
140,1
125,2
80,9
Sapphire Radeon R9 290X
146,9
133,7
86,3
Sapphire Radeon R9 290X Tri-X OC
148,1
139,8
89,9
NVIDIA GeForce GTX780Ti
153,4
139,9
90,3
MSI GeForce GTX780Ti Gaming
162,4
146
93
Sapphire Radeon R9 290X Vapor-X Tri-X OC
166,6
151,3
96,8
Sapphire Radeon HD7990
199
180,6
114,2
Sapphire Radeon HD7970 DualX OC CFX
201,3
183,2
117,6
Sapphire Radeon HD7990 CFX
385,7
354,3
223
Test: overclock ed overvolt–>
Bar chart. Data table with 20 rows and 4 columns follows.
| 1050p | 1080p | 1440p | |
|---|---|---|---|
| ASUS GeForce GTX750Ti DirectCU II OC | 0 | 0 | 0 |
| Sapphire Radeon R7 250 Ultimate | 34 | 29 | 17 |
| Sapphire Radeon R7 260X OC 2GB | 45 | 42 | 32 |
| NVIDIA GeForce GTX750Ti | 73 | 67 | 40 |
| Sapphire Radeon R7 265 Dual-X | 69 | 66 | 42 |
| MSI Radeon R9 270 Gaming 2GB | 63 | 58 | 45 |
| Sapphire Radeon R9 280 Dual-X | 74 | 70 | 53 |
| Sapphire R9 285 ITX Compact | 95 | 87 | 62 |
| ASUS Radeon R9 270X DirectCU II TOP | 87 | 77 | 63 |
| Gigabyte GeForce GTX760 WF3 OC 4GB | 117 | 100 | 67 |
| Sapphire Radeon R9 280X Toxic | 111 | 101 | 71 |
| Sapphire Radeon R9 290 | 122 | 111 | 76 |
| Sapphire Radeon R9 290X | 129 | 116 | 81 |
| Sapphire Radeon R9 290X Tri-X OC | 133 | 119 | 84 |
| MSI GeForce GTX770 Gaming | 149 | 136 | 87 |
| Sapphire Radeon R9 290X Vapor-X Tri-X OC | 115 | 108 | 88 |
| MSI GeForce GTX780 OC Gaming | 146 | 133 | 103 |
| Inno3D GeForce GTX780 iChill Accelero Hybrid | 164 | 156 | 118 |
| MSI GeForce GTX780Ti Gaming | 182 | 167 | 125 |
Bar chart. Data table with 31 rows and 4 columns follows.
| 1050p | 1080p | 1440p | |
|---|---|---|---|
| Sapphire Radeon R7 250 Ultimate | 17,14 | 14,84 | 9,49 |
| Sapphire Radeon R7 260X OC 2GB | 26,32 | 23,95 | 17,6 |
| NVIDIA GeForce GTX750Ti | 33,29 | 29,51 | 18,73 |
| ASUS GeForce GTX750Ti DirectCU II OC | 36,56 | 32,51 | 20,62 |
| Sapphire Radeon R7 265 Dual-X | 37,5 | 33,51 | 21,91 |
| NVIDIA GeForce GTX760 | 39,7 | 30,57 | 22,13 |
| MSI Radeon R9 270 Gaming 2GB | 41,85 | 37 | 24 |
| ASUS Radeon R9 270X DirectCU II TOP | 47,97 | 42,83 | 27,3 |
| Sapphire Radeon R9 270X Vapor-X | 46,92 | 42,04 | 27,53 |
| Gigabyte GeForce GTX760 WF3 OC 4GB | 48,45 | 43,99 | 29,63 |
| MSI GeForce GTX760 Hawk | 51,89 | 46,82 | 31,6 |
| Sapphire Radeon R9 280 Dual-X | 52,14 | 46,92 | 32,16 |
| Sapphire Radeon R9 285 ITX Compact | 60,02 | 53,43 | 34,61 |
| Sapphire Radeon HD7970 DualX OC | 56,22 | 51,06 | 35,28 |
| NVIDIA GeForce GTX770 | 59,01 | 52,73 | 35,55 |
| Gigabyte GeForce GTX770 WF3 OC | 64,03 | 58,1 | 39,27 |
| MSI GeForce GTX770 Gaming | 66,22 | 60,07 | 39,46 |
| Sapphire Radeon R9 280X Toxic | 65,78 | 59,34 | 40,79 |
| NVIDIA GeForce GTX780 | 66,58 | 60,56 | 43,1 |
| Sapphire Radeon R9 290 | 76,73 | 68,67 | 46,49 |
| MSI GeForce GTX780 OC Gaming | 74,79 | 68,44 | 47,95 |
| Sapphire Radeon HD7990 | 78 | 68 | 51 |
| Sapphire Radeon R9 290X | 83,12 | 74,48 | 51,67 |
| Sapphire Radeon R9 290X Tri-X OC | 86,26 | 77,59 | 53,47 |
| NVIDIA GeForce GTX780Ti | 86,53 | 77,68 | 53,54 |
| Inno3D GeForce GTX780 iChill Accelero Hybrid | 85,71 | 78,2 | 53,76 |
| Sapphire Radeon R9 290X Vapor-X Tri-X OC | 90,92 | 81,15 | 54,9 |
| Sapphire Radeon HD7990 CFX | 78,5 | 73,67 | 56,05 |
| Sapphire Radeon HD7970 DualX OC CFX | 83,06 | 77,56 | 57,69 |
| Sapphire Radeon HD7990 CFX | 171,33 | 158,49 | 114,81 |
Test sui giochi: Tomb Raider (2013)–> Lara Croft. Chiunque abbia un minimo di conoscenza videoludica sa chi si nasconde dietro questo nome: la formosa cacciatrice di tesori intorno alla quale è incentrata la serie Tomb Raider. Nel capitolo che ha visto la luce quest’anno, viene effettuato un vero e proprio fast backward, approfittando di un “reboot” della serie per mostrare al giocatore una Lara Croft appena laureata e alle prese con la sua prima avventura. Ovviamente, le forme (e sì, anche l’avventura) non mancano. Il gioco supporta le DirectX11.1, con il feature level di tipo 11_1, le cui istruzioni vengono utilizzate dal TressFX, tecnologia open source che permette di renderizzare i capelli in maniera più realistica, e se supportata dall’hardware, senza un impatto consistente sulle prestazioni. Il motore grafico utilizzato è proprietario di Crystal Dynamics, e consente di scalare discretamente su macchine di potenza diversa senza influire troppo negativamente sull’aspetto delle texture. Il gioco è ottimizzato per architetture AMD, in quanto parte del programma AMD Gaming Evolved.
Tomb Raider (2013)(Z97)
Bar chart. Data table with 31 rows and 4 columns follows.
Tomb Raider (2013)(Z97)
1050p
1080p
1440p
Sapphire Radeon R7 250 Ultimate
29,2
25,8
15,3
ASUS GeForce GTX750Ti DirectCU II OC
52,6
46,8
28,8
NVIDIA GeForce GTX750Ti
53
47,7
29,4
Sapphire Radeon R7 260X OC 2GB
54,1
48,4
29,7
Sapphire Radeon R7 265 Dual-X
60,4
54,3
33,3
NVIDIA GeForce GTX760
80,6
60,5
41,5
MSI Radeon R9 270 Gaming 2GB
76,8
68,44
42,9
Sapphire Radeon R9 270X Vapor-X
82,6
75,2
46,3
Gigabyte GeForce GTX760 WF3 OC 4GB
84,6
76,2
48,6
ASUS Radeon R9 270X DirectCU II TOP
87,9
79,2
49,1
Sapphire Radeon R9 280 Dual-X
85,2
76,3
49,3
Sapphire Radeon R9 285 ITX Compact
87,9
78,9
50,4
MSI GeForce GTX760 Hawk
90,1
81,3
50,9
NVIDIA GeForce GTX770
92,5
82,2
53,8
MSI GeForce GTX770 Gaming
103
91,2
57,9
Sapphire Radeon HD7970 DualX OC
99,5
90,9
59,5
Gigabyte GeForce GTX770 WF3 OC
114,5
101,5
64,6
Sapphire Radeon R9 280X Toxic
113,1
103,5
66,1
NVIDIA GeForce GTX780
119,3
107,1
68,3
MSI GeForce GTX780 OC Gaming
132,6
119,8
78,2
Sapphire Radeon R9 290
137,8
123,6
79,5
Inno3D GeForce GTX780 iChill Accelero Hybrid
140,1
125,2
80,9
Sapphire Radeon R9 290X
146,9
133,7
86,3
Sapphire Radeon R9 290X Tri-X OC
148,1
139,8
89,9
NVIDIA GeForce GTX780Ti
153,4
139,9
90,3
MSI GeForce GTX780Ti Gaming
162,4
146
93
Sapphire Radeon R9 290X Vapor-X Tri-X OC
166,6
151,3
96,8
Sapphire Radeon HD7990
199
180,6
114,2
Sapphire Radeon HD7970 DualX OC CFX
201,3
183,2
117,6
Sapphire Radeon HD7990 CFX
385,7
354,3
223
Test: overclock ed overvolt–>
Bar chart. Data table with 31 rows and 4 columns follows.
| 1050p | 1080p | 1440p | |
|---|---|---|---|
| Sapphire Radeon R7 250 Ultimate | 29,2 | 25,8 | 15,3 |
| ASUS GeForce GTX750Ti DirectCU II OC | 52,6 | 46,8 | 28,8 |
| NVIDIA GeForce GTX750Ti | 53 | 47,7 | 29,4 |
| Sapphire Radeon R7 260X OC 2GB | 54,1 | 48,4 | 29,7 |
| Sapphire Radeon R7 265 Dual-X | 60,4 | 54,3 | 33,3 |
| NVIDIA GeForce GTX760 | 80,6 | 60,5 | 41,5 |
| MSI Radeon R9 270 Gaming 2GB | 76,8 | 68,44 | 42,9 |
| Sapphire Radeon R9 270X Vapor-X | 82,6 | 75,2 | 46,3 |
| Gigabyte GeForce GTX760 WF3 OC 4GB | 84,6 | 76,2 | 48,6 |
| ASUS Radeon R9 270X DirectCU II TOP | 87,9 | 79,2 | 49,1 |
| Sapphire Radeon R9 280 Dual-X | 85,2 | 76,3 | 49,3 |
| Sapphire Radeon R9 285 ITX Compact | 87,9 | 78,9 | 50,4 |
| MSI GeForce GTX760 Hawk | 90,1 | 81,3 | 50,9 |
| NVIDIA GeForce GTX770 | 92,5 | 82,2 | 53,8 |
| MSI GeForce GTX770 Gaming | 103 | 91,2 | 57,9 |
| Sapphire Radeon HD7970 DualX OC | 99,5 | 90,9 | 59,5 |
| Gigabyte GeForce GTX770 WF3 OC | 114,5 | 101,5 | 64,6 |
| Sapphire Radeon R9 280X Toxic | 113,1 | 103,5 | 66,1 |
| NVIDIA GeForce GTX780 | 119,3 | 107,1 | 68,3 |
| MSI GeForce GTX780 OC Gaming | 132,6 | 119,8 | 78,2 |
| Sapphire Radeon R9 290 | 137,8 | 123,6 | 79,5 |
| Inno3D GeForce GTX780 iChill Accelero Hybrid | 140,1 | 125,2 | 80,9 |
| Sapphire Radeon R9 290X | 146,9 | 133,7 | 86,3 |
| Sapphire Radeon R9 290X Tri-X OC | 148,1 | 139,8 | 89,9 |
| NVIDIA GeForce GTX780Ti | 153,4 | 139,9 | 90,3 |
| MSI GeForce GTX780Ti Gaming | 162,4 | 146 | 93 |
| Sapphire Radeon R9 290X Vapor-X Tri-X OC | 166,6 | 151,3 | 96,8 |
| Sapphire Radeon HD7990 | 199 | 180,6 | 114,2 |
| Sapphire Radeon HD7970 DualX OC CFX | 201,3 | 183,2 | 117,6 |
| Sapphire Radeon HD7990 CFX | 385,7 | 354,3 | 223 |
Una scheda con un sistema di raffreddamento così efficiente ovviamente non può essere lasciata a default. Ci siamo armati quindi dell’ultima versione di TriXX (4.6.3 Beta) compatibile con la serie R9/R7 di AMD, e abbiamo provveduto ad overclockare la scheda.
Ricordiamo che i clock standard della R9 270X VaporX sono di 1100 MHz sulla GPU e 1450 MHz sulle RAM. Questo, il nostro risultato:
Bar chart. Data table with 31 rows and 3 columns follows.
| Default | OC | |
|---|---|---|
| Sapphire Radeon R7 250 Ultimate | 3.346 | |
| NVIDIA GeForce GTX750Ti | 5.699 | 6.264 |
| ASUS GeForce GTX750Ti DirectCU II OC | 6.027 | 6.669 |
| MSI Radeon HD7790 OC | 6.079 | 7.800 |
| Sapphire Radeon R7 260X OC 2GB | 6.741 | 7.741 |
| Sapphire Radeon R7 265 Dual-X | 7.097 | 9.906 |
| MSI Radeon R9 270 Gaming 2GB | 8.079 | 9.928 |
| NVIDIA GeForce GTX760 | 8.273 | 9.380 |
| Gigabyte GeForce GTX760 WF3 OC 4GB | 8.656 | 9.258 |
| Sapphire Radeon R9 270X Vapor-X | 8.939 | 10.631 |
| ASUS Radeon R9 270X DirectCU II TOP | 9.120 | 11.246 |
| MSI GeForce GTX760 Hawk | 9.294 | 9.872 |
| Sapphire Radeon R9 280 Dual-X | 9.360 | 13.300 |
| Sapphire Radeon HD7970 DualX OC | 9.963 | |
| NVIDIA GeForce GTX770 | 10.446 | 12.027 |
| Sapphire R9 285 ITX Compact | 10.558 | 12.262 |
| MSI GeForce GTX770 Gaming | 11.244 | 12.067 |
| Gigabyte GeForce GTX770 WF3 OC | 11.414 | 12.195 |
| Sapphire Radeon R9 280X Toxic | 11.603 | 13.813 |
| MSI GeForce GTX780 OC Gaming | 12.726 | 13.310 |
| NVIDIA GeForce GTX780 | 12.848 | 14.117 |
| Sapphire Radeon R9 290 | 13.311 | 16.206 |
| Inno3D GeForce GTX780 iChill Accelero Hybrid | 13.736 | 14.183 |
| NVIDIA GeForce GTX780Ti | 13.956 | 15.663 |
| Sapphire Radeon R9 290X | 14.006 | 17.398 |
| Sapphire Radeon R9 290X Tri-X OC | 14.263 | 15.793 |
| Sapphire Radeon R9 290X Vapor-X Tri-X OC | 14.534 | 17.384 |
| MSI GeForce GTX780Ti Gaming | 14.832 | 15.698 |
| Sapphire Radeon HD7990 | 15.047 | |
| Sapphire Radeon HD7970 DualX OC CFX | 16.360 | 18.463 |
Abbiamo portato, grazie ad un aumento del voltaggio di 37 mV, la GPU a 1200 MHz e le RAM a 1500 MHz. Il risultato nel 3DMark11 (benchmark che a nostro avviso rispecchia abbastanza fedelmente l’aumento di prestazioni ottenuto grazie all’overclock), con la tassellazione disattivata:
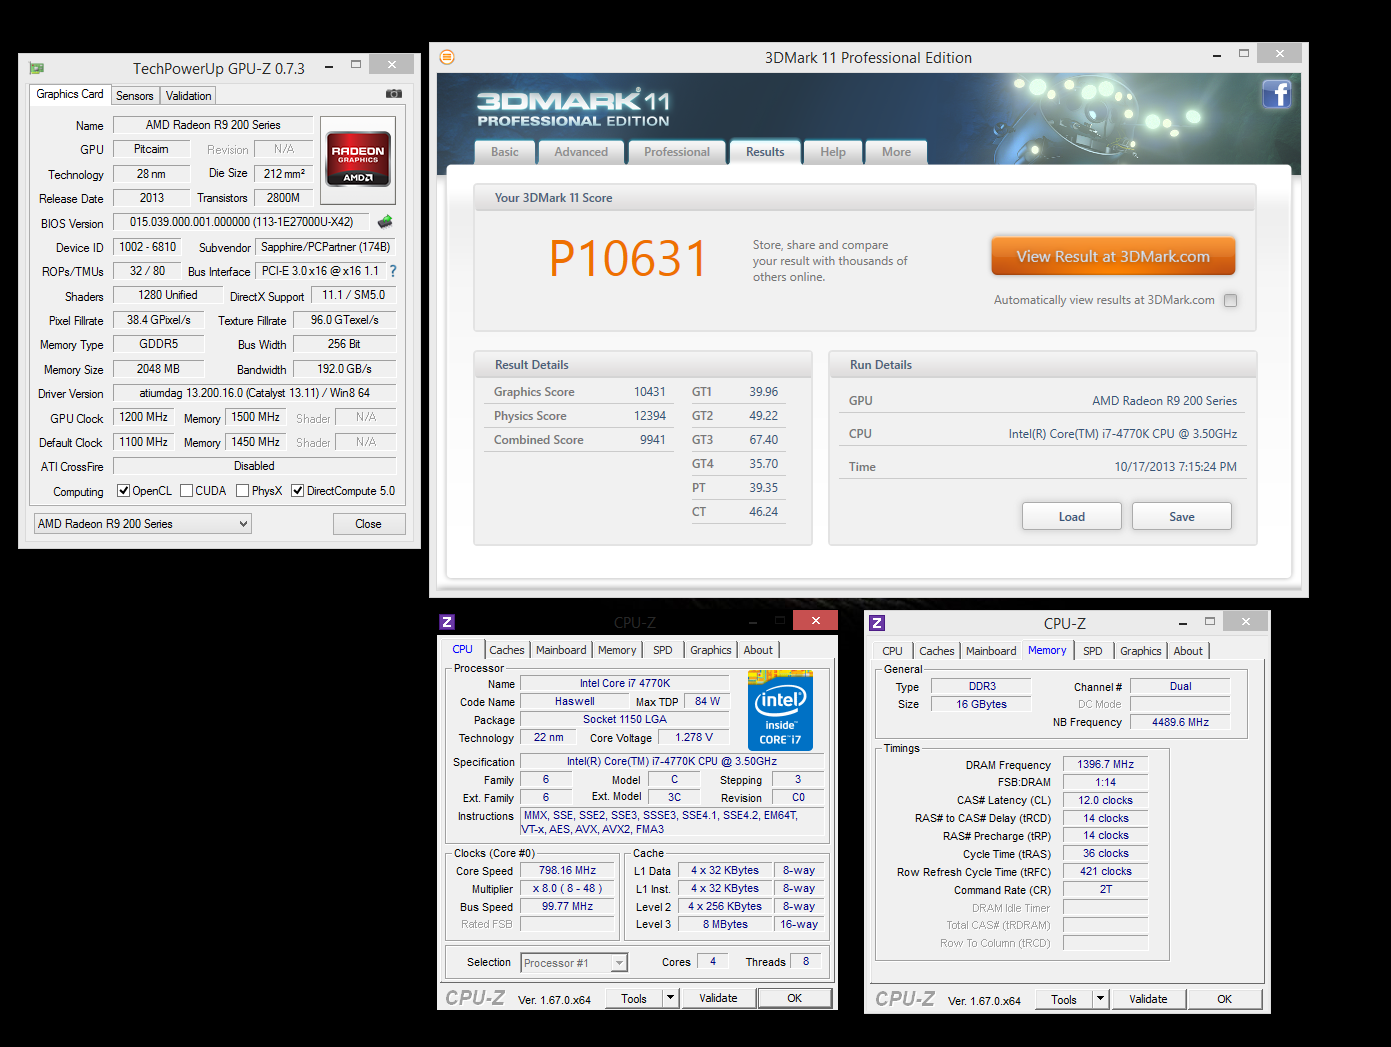
L’incremento della potenza di calcolo è abbastanza marcato, anche se il boost nei punti ottenuti dal benchmark è dovuto più alla disattivazione della Tessellation che all’aumento di frequenza. Comunque sia, questo punteggio ci vale il primo posto di categoria su HwBot.
Considerazioni finali–>
[conclusione]
[titolo]Design e qualità costruttiva[/titolo]
Il design introdotto con questa scheda grafica è originale e non riprende le linee tracciate da alcun modello dell’azienda. La struttura in metallo e la doppia ventola, unite alla Vapor Champer, consentono di avere una scheda letteralmente gelida, che non ha superato i 56°C durante gli stress test. Con la ventola al 100%, tale temperatura è scesa addirittura a 45°C, segno che il design è ben studiato e il sistema di trasferimento del calore è efficiente e adeguatamente dimensionato. L’unico difetto, o meglio, l’unico miglioramento nella scheda che avremmo preferito è la retroilluminazione della “coda” in plastica trasparente blu, in modo da aumentare l’impatto estetico.
[voto=”9″]
[/conclusione]
[conclusione]
[titolo]Prestazioni e overclock[/titolo]
Le prestazioni a default della scheda sono in linea con quelle di una HD7870 a pari frequenza, pertanto sono più che sufficienti per giocare in FullHD senza compromessi, scendendo nei dettagli man mano che vengono pubblicati giochi più esosi in termini di risorse hardware. I 2GB di memoria onboard “limitano”, insieme al bus a 256 Bit, l’utilizzo entro la risoluzione FullHD, risultando una scheda non propriamente adatta alla risoluzione, ad esempio, di 2560×1440 pixels, dove per giocare dovrete scendere a compromessi consistenti. In overclock, nonostante l’overvolt applicabile fosse ridotto, siamo riusciti ad aumentare ulteriormente le prestazioni già discrete, anche se non ci siamo trovati di fronte un esemplare da overclock.
[voto=”8″]
[/conclusione]
[conclusione]
[titolo]Compatibilità[/titolo]
Sul fattore compatibilità, la scheda dispone di connessione PCI-E 16x di tipo 3.0, retrocompatibile con lo standard 2.0 (non è assicurata la compatibilità su schede madri con connessione PCI-E 16x di prima generazione), mentre da lato alimentatore è suggerito dall’azienda un alimentatore da almeno 600W. Noi di ReHWolution, però, possiamo garantirvi che basta un buon alimentatore da 500W per assicurarvi la piena stabilità operativa. Qualora voleste configurare un sistema multiGPU, l’alimentatore consigliato è di 700W, in modo da avere un ottimo margine di overclock.
[voto=”9″]
[/conclusione]
[conclusione]
[titolo]Prezzo[/titolo]
Il prezzo della scheda è di 219€ iva inclusa. Considerando che la scheda è un rebranding della HD7870, e considerando anche la personalizzazione del PCB e del sistema di raffreddamento, il prezzo ci sembra abbastanza competitivo, ed essendo il prezzo di lancio, è destinato senz’altro a calare, offrendo un maggior rapporto qualità/prezzo. Vi invitiamo ad acquistare presso i rivenditori ufficiali Sapphire, in quanto pur presentando un prezzo superiore ai VAT Player (coloro che evadono l’iva tramite meccanismi al limite della legalità), forniscono supporto post-vendita/RMA, cosa che suddetti rivenditori non ufficiali non garantiscono.
[voto=”8″]
[/conclusione]
In virtù di quanto analizzato in questa recensione, diamo alla scheda 8 stelle su 10:

Ringraziamo Sapphire Italia per il sample oggi recensito.
Un saluto da Hades, alla prossima recensione!
La recensione
Sapphire Radeon R9-270X Vapor-X
La soluzione personalizzata di Sapphire della "nuova" R9-270X, dotata di dissipatore a camera di vapore denominato Vapor-X, insieme ad un design originale.
Pro
- PCB e dissipatore custom
- Sistema Vapor-X: la scheda è freddissima
- Overclock di fabbrica
- Prestazioni discrete fino a 1920x1080
- La differenza di prezzo con la reference non è elevata
Contro
- Overclock possibile ma non esagerato
- Estetica migliorabile




Discussione su post